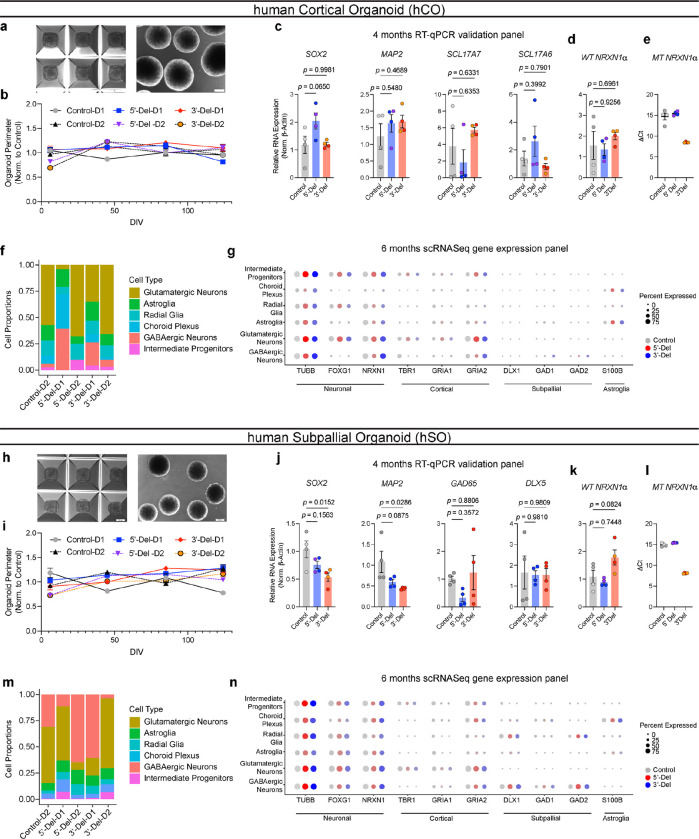
Extended Data Figure 3: Extended data on human organoid generation and characterization.
(a,h) Representative images of hiPSC aggregation and immature spheroids post dislodging. (b,i) Normalized organoid perimeters over time (compared to averaged control), hCO (n = 6 donors | 2 batches | 72–161 organoids) and hSO (n = 6 donors | 2 batches | 46–134 organoids). (c, j) RT-qPCR results from 4-month organoids of genes for pluripotency, neuronal, and cell-type specific markers. (d-e, k-l) RT-qPCR results of NRXN1 WT and MT expression hCO (n = 6 donors | 1 representative batch | 12 samples) and hSO (n = 6 donors | 1 representative batch | 12 samples). Statistical tests used were 1-way ANOVAs with Dunnett’s test. (f, m) relative proportions of cell clusters across individual donors, (hCO = 47,460 cells) and (hSO = 35,563 cells). (g, n) Comprehensive gene expression panel across sub-clusters of hCO and hSO samples across neuronal, cortical, subpallial and astroglia markers. Data corresponds to Fig 2.

