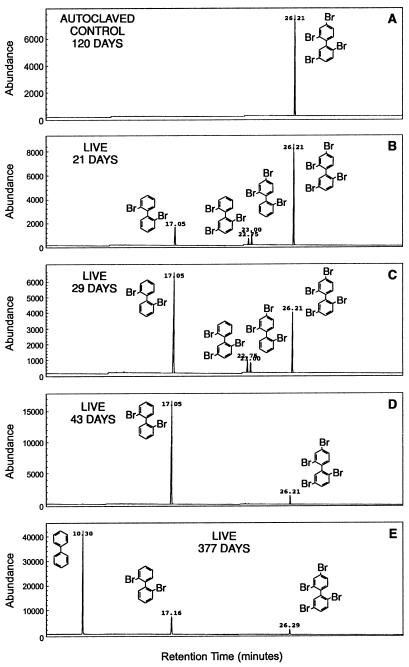
FIG. 5.
Total ion chromatogram of 24-25-BB and its dehalogenation products at various times. The dehalogenation of 24-25-BB was monitored by GC-MS as described in Materials and Methods. The areas plotted for each compound represent the sum of selected ions for that compound and therefore are not directly comparable to concentration. However, the plots do indicate the progress of the dehalogenation. (A) Autoclaved control at 120 days. (B through E) Live samples showing the dehalogenation products present at 21, 29, 43, and 377 days. The retention times have shifted slightly for the sample at 377 days because this sample was analyzed many months later than the other samples.

