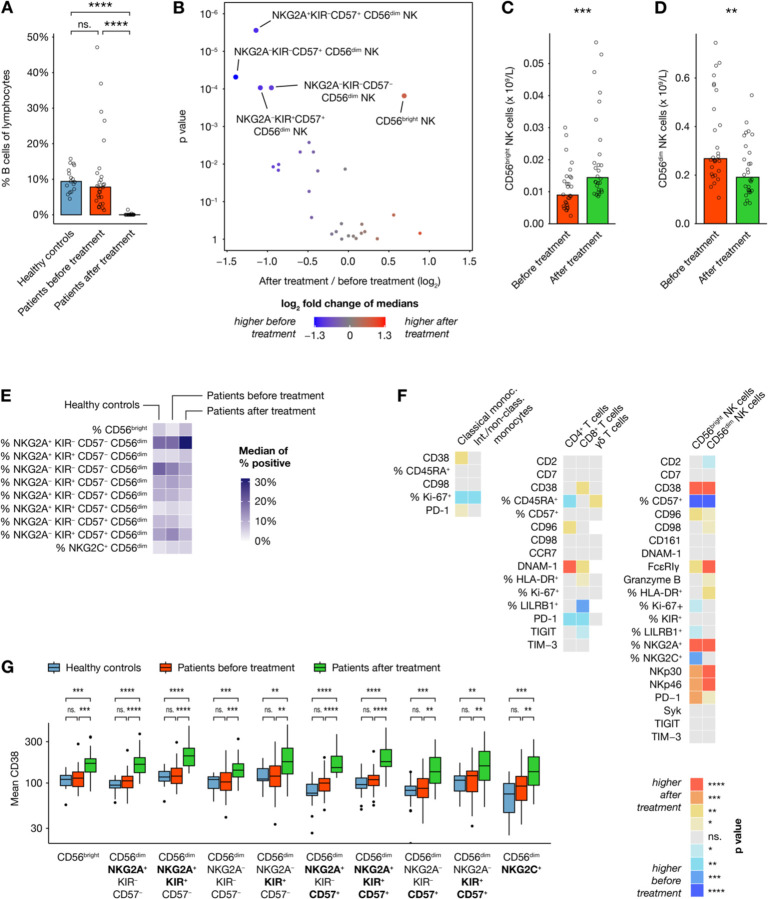
Figure 4. Effects of treatment on immune cell phenotypes.
(A) B cell frequencies as percentage of all CD45+ in healthy controls (n=17) and all patients (n=28) before and after treatment. (B) Volcano plot showing differences in absolute counts of 28 cell subsets before and after treatment (n=28). (C–D) Selected comparisons from (B). (E) Heatmap showing median frequencies of key NK cell subsets as percentage of bulk NK cells in healthy controls (n=17) and patients (n=28) before and after therapy. (F) Heatmap showing differences in marker expression within multiple immune cell subsets between patients before and after treatment (n=20–28), with colors indicating direction of difference and statistical significance from paired nonparametric tests without p value adjustment. (G) Mean CD38 expression in multiple NK cell subsets of healthy controls (n=15–17) and patients (n=25–28) before and after treatment.

