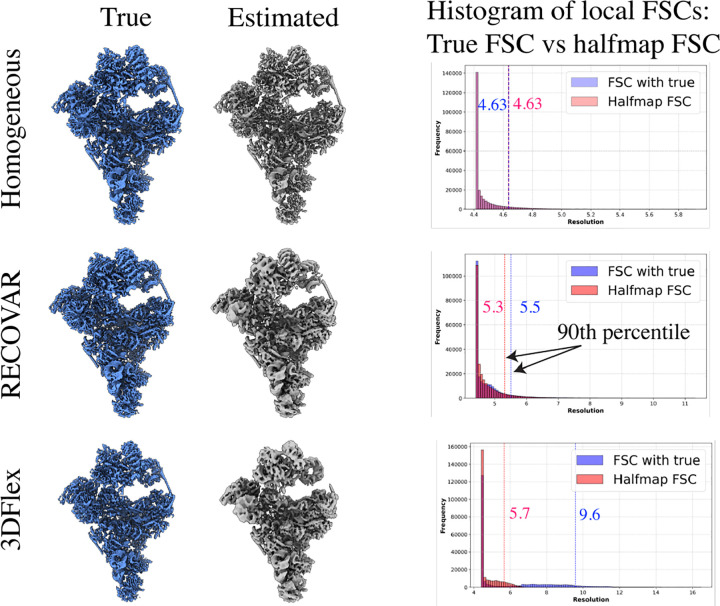
Figure A.10:
Illustration of the bias of the “gold-standard” FSC scores computed from halfmaps in heterogeneous reconstructions. Top: A homogeneous reconstruction of a state from a homogeneous synthetic dataset. The histogram of local FSC between the true state and the combined state (FSC threshold of 1/2) and the histogram of the FSC between halfmaps (FSC threshold of 1/7) overlap perfectly, as the halfmap FSC is an unbiased estimate of the true FSC. Middle: A RECOVAR reconstruction of the highest density state in the synthetic dataset in section 1.6. In this case, the histograms do not overlap as the halfmap FSC is a biased estimator of the true FSC and overestimates the resolution. Bottom: The 3Dflex “flexible reconstruction” of the whole synthetic dataset in section 1.6, compared to the most similar of the 1640 true volumes (as measured by the 90% percentile of local resolution score). The halfmap FSC of the flexible reconstruction vastly overestimates the true resolution of the flexible reconstruction.

