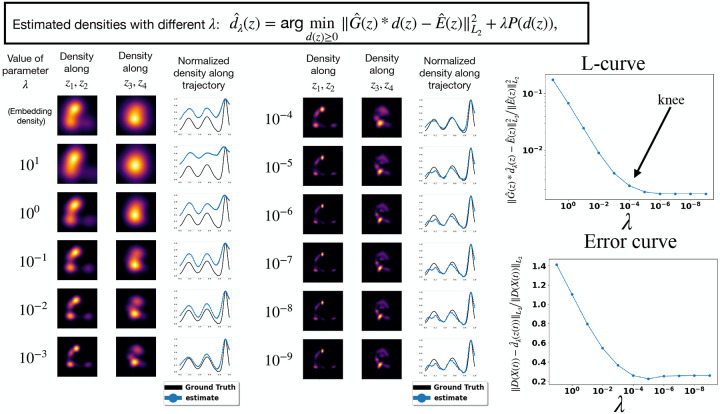
Figure A.8:
Illustration of density estimation with different regularization parameters on the synthetic dataset described in section 1.6. (Left) Embedding density and estimated densities with 11 different values of the parameter . The density is estimated over 4 dimensions and is plotted over pairs of axes by integrating along the remaining axes. Also plotted is the estimated density along the top-down trajectory vs the ground truth density. (Right) Computed L-curve and error curve between the true density and estimated along the true trajectory. The L-curve can be computed without knowledge of the ground truth as it only uses the residual. The L-curve criterion identifies the knee in the L-curve as the parameter choice for the inverse problem, here around . This value is used to generate figures in fig. 2.

