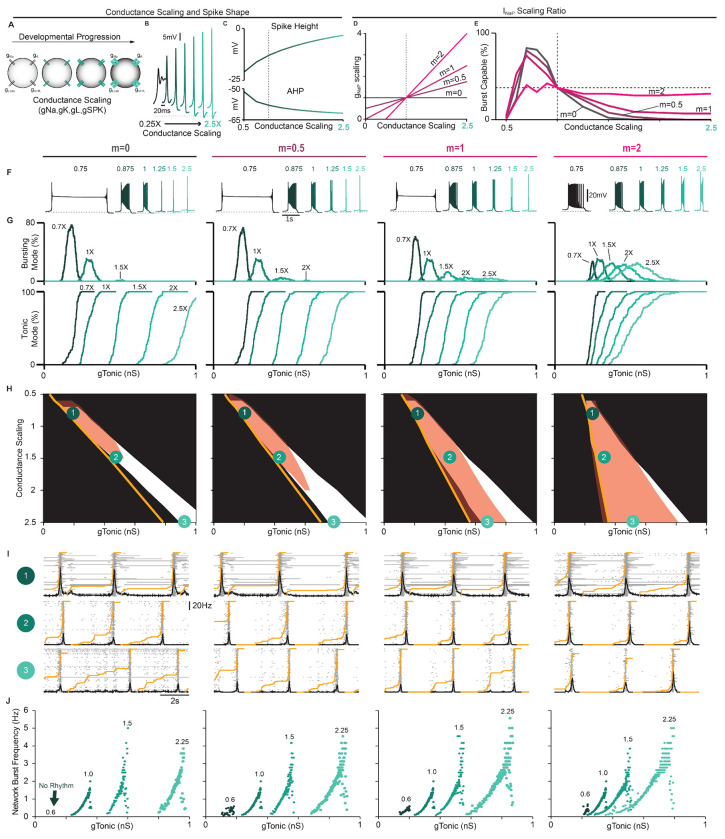
Figure 6. Predicted developmental changes in spike shape, intrinsic bursting and network dynamics due to changing conductance densities.
(A) Illustration of conductance scaling during development. (B) Example traces and (C) quantification of spike height and AHP as conductances axe scaled. (D) Ratios of concurrent gNaP scaling (m = 0 – 2) and (E) percentage of the network (gSPK = U(0, 12) nS) that is burst-capable as conductances axe up- or down-scaled from control values (dashed vertical line). (F) Example intrinsic bursting neurons during conductance scaling with m = 0 – 2. (G) Decreased excitability with conductance scaling as indicated by a rightward shift in the level of gTonic needed to initiate intrinsic bursting or tonic spiking. (H) Comparison of parameter space that supports intrinsic bursting (red) and network rhythmogenesis (white) as conductances are scaled with m ranging from 0 – 2 (Orange lines indicate gTonic where ≥ 1 neuron enters tonic spiking mode). (I) Raster plots and overlaid network firing rate corresponding to points 1-3 in (H) (Orange line indicate the percentage of neurons active since the preceding network burst). (J) Relationship between excitability (gTonic) and network burst frequency as conductances are scaled with m ranging from 0 – 2.

