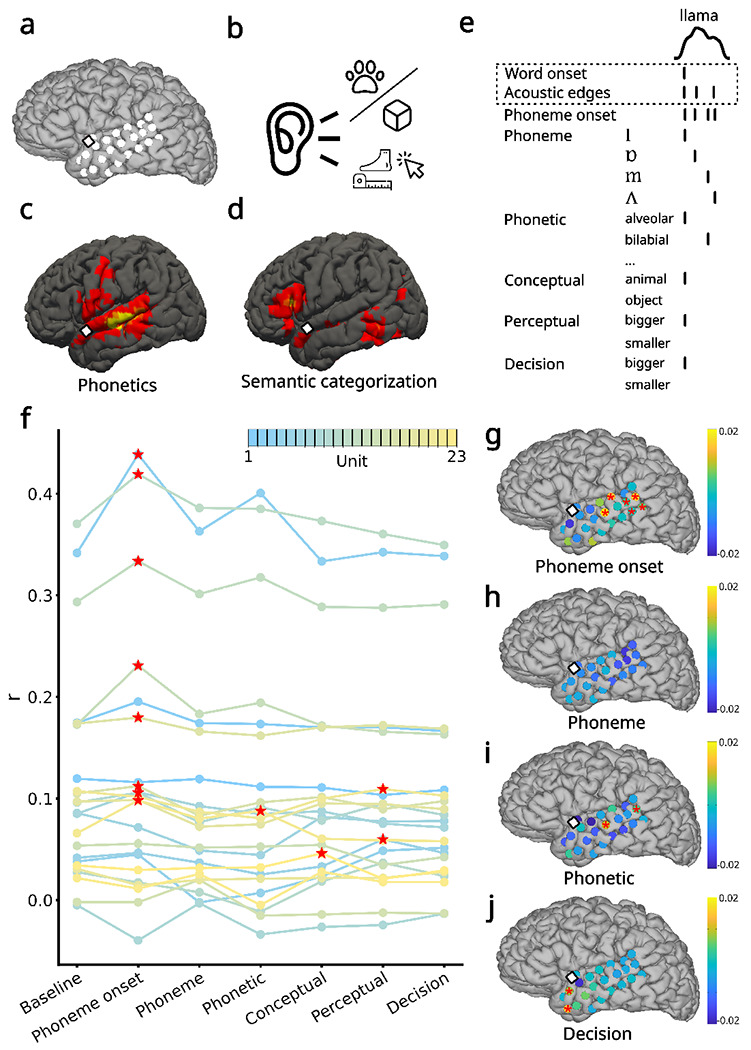
Fig. 1 |. Semantic and phonetic encoding at the single-unit level in the aSTG.

a. Locations of the microelectrode array (square) and the ECoG array (circles) on the cortical surface. b. Experimental design of the auditory semantic categorization task. The participant heard 400 nouns that denoted either animals or objects and was instructed to press a button if the item he heard was bigger than a foot in size. c. fMRI correlates of phonetic processing obtained from fMRI large-scale databases. d. fMRI correlates of semantic categorization. e. mTRF features for the example word ”llama”. The time series at the top indicates the speech envelope. The features used in the baseline model are indicated by a dotted square. f. Pearson correlation coefficient (r) for each model and 23 single units with the highest firing rates in the ensemble. The traces for different units are color-coded based on their firing rate, from lower (blue) to higher (yellow). Red stars indicate model-unit pairs that were significantly higher than the baseline in a permutation test. g-j Encoding of phoneme onsets, phonemes, phonetic categories, and semantic decision across ECoG channels. Colors indicate differences in r values compared to the baseline model. Red stars indicate ECoG channels that were significantly higher than the baseline in a permutation test.
