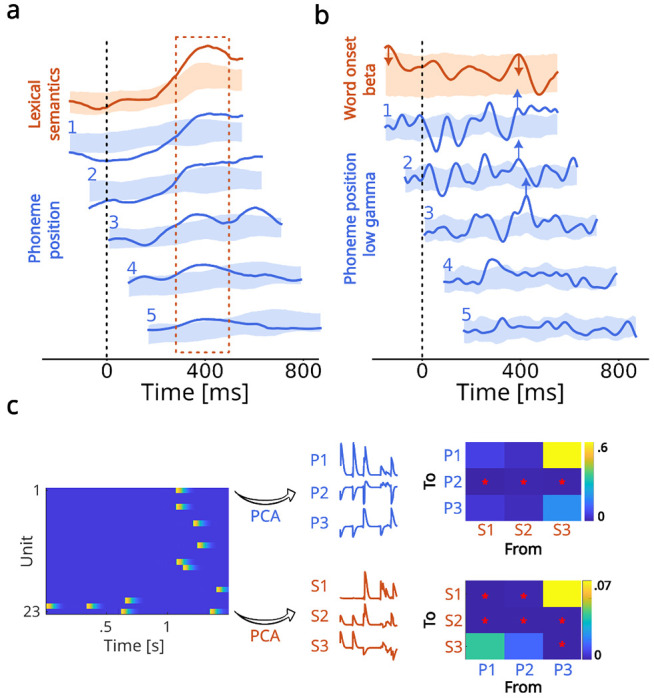
Fig. 5 |. Parallel encoding of bottom-up phonetic and top-down semantic features.

a. Kernels for phoneme positions (blue) within a word shifted by average phoneme duration (80 ms) and aligned with the lexical semantic kernel at word onset (red). Aligned phoneme position kernels peaked simultaneously with the onset of the lexical semantic kernel peak. b. Beta band kernel for word onset is indicated in red, and low-gamma kernels for phoneme positions are indicated in blue and shifted by average phoneme duration. The late peak in the beta word-onset kernel occurred simultaneously with the aligned low-gamma phoneme onset peaks. c. Granger causality between phonetic and semantic low-dimensional representations. The left plot shows a 1.5-second snippet of the spiking data recorded during natural speech perception. These are projected onto three PCs to obtain time-varying phonetic (P) and semantic (S) features, which are then used in the Granger causality analysis. Matrices indicate p-values of Granger’s F-test for a causal relationship from the imensions indicated on the x-axis to the dimensions indicated on the y-axis. The stars indicate significant relationships at the 0.05 threshold. There was a significant causal relationship in both directions (i.e., phonetic to semantic and vice versa).
