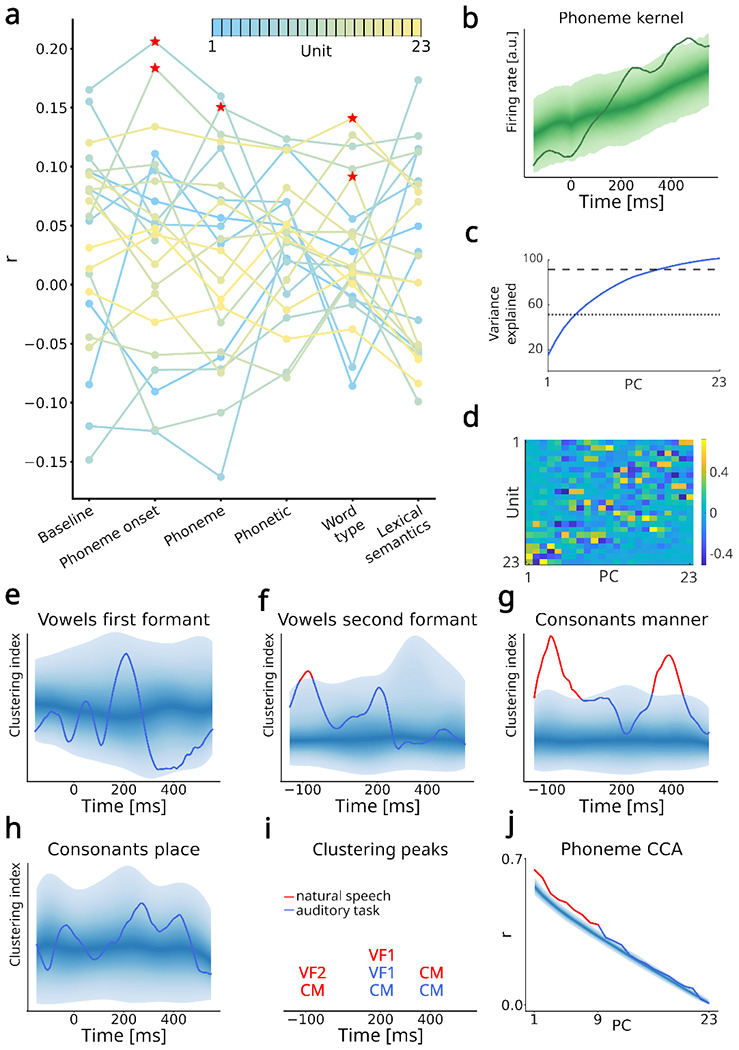
Fig. 3 |. Generalization to natural speech perception.

a. r values for each model and the 23 most-spiking units. The units are color-coded based on their firing rate, from blue (lower) to yellow (higher). Red stars indicate model-unit pairs significantly higher than the baseline in a permutation test. b. Average across mTRF phoneme kernels. The 95% confidence region of the surrogate (chance-level) distribution is shown with brighter shading for increasingly peripheral percentiles. The averaged phoneme kernel was significant at two time periods, centered around 200 and 400 ms. c. PCA variance explained. Five PCs explained 50% of variance (dotted line) and 15 explained 90% (dashed line). d. Principal component (PC) coefficients of identified units. Several units are represented in the first PCs, indicating distributed encoding of phonemes also during natural speech perception. e-h. Clustering index for the four groups of phonetic features. Shading as in b. Red segments indicate significant periods after multiple comparison correction (cluster-based test). i. Overview of the significant clustering peaks observed both during the semantic task and natural speech perception. j. Canonical correlation analysis (CCA) between the PC projections of phoneme kernels obtained during the semantic task and natural speech perception. Shading and red segments as in b. CCA revealed significant correlations for the first nine PCs.
