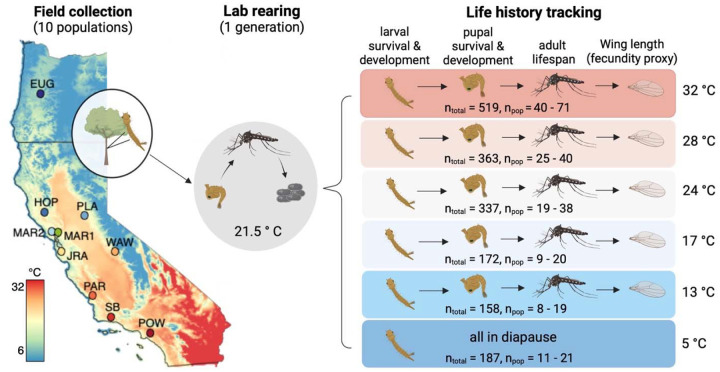
Figure 1.
Sample collection locations and experimental design used to measure mosquito thermal performance. Ten populations were collected as larvae from tree holes across the Western U.S. and reared in the lab under common conditions for one generation. The resulting larvae from each population were randomly designated into one of six temperature treatments. The total number of larvae assigned to each treatment is noted above (‘ntotal’) as is the range of larvae from each population (‘npop’); Supplemental Table S2 indicates the full breakdown of larvae per population and treatment). Individuals were checked daily for life stage transitions (e.g., larvae to pupae, pupae to adult) or death. Map colors denote the average maximum annual temperature () from 1991 – 2020 from PRISM data. Supplemental Figure S1 shows the average minimum and mean temperature across this same extent. Population metadata, including full site names, latitude, longitude, and elevation are provided in Supplemental Table S1.

