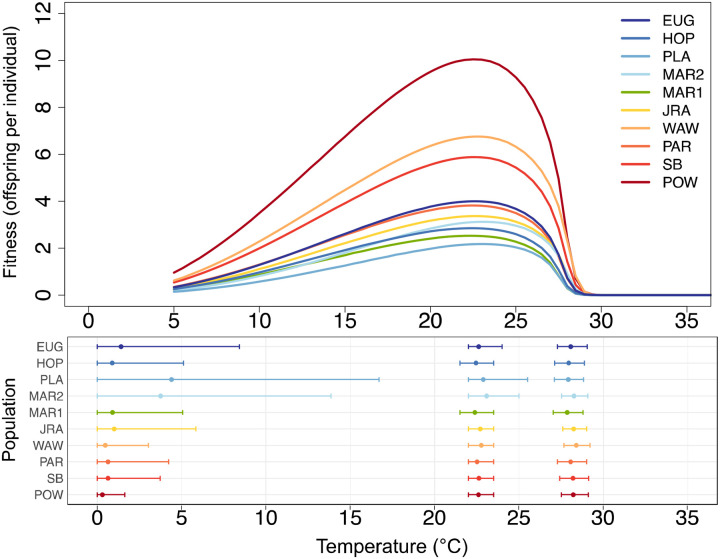
Figure 2. Populations vary minimally in their thermal limits and optima for fitness.
In the top panel, each line denotes the mean thermal performance of our fitness proxy for one population. In the bottom panel, points denote estimated thermal performance parameters for our fitness proxy for each population, including lower thermal limit (left), thermal optima (middle), and upper thermal limit (right). Error bars denote the 95% credible intervals for each parameter. In both panels, populations are colored and ordered by their latitude of collection from north (blue) to south (red); this color scheme and ordering is consistent across all figures in the paper.

