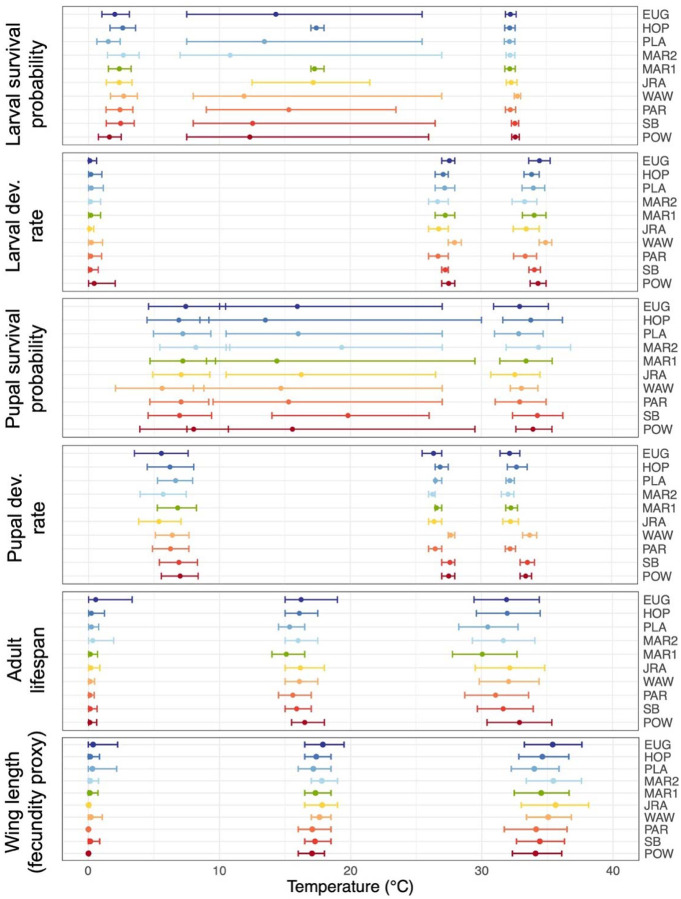
Figure 4. Thermal limits and optima vary between life history traits, but minimally between populations.
Lower thermal limits, thermal optima, and upper thermal limits for each life history trait and population (left, middle, and right points and error bars in each panel, respectively). Thermal performance parameter estimates are derived from the thermal performance curves for traits for which the means are depicted in Figure 3. Points and error bars denote the mean and 95% credible intervals for each parameter, respectively. Populations (listed on the right) are colored and ordered by latitude of collection. Units of development rates and lifespan are 1/days and days, respectively. Note that survival probability curves that are truncated at one have very uncertain optimal temperatures because a wide range of temperatures have similarly high survival probability.

