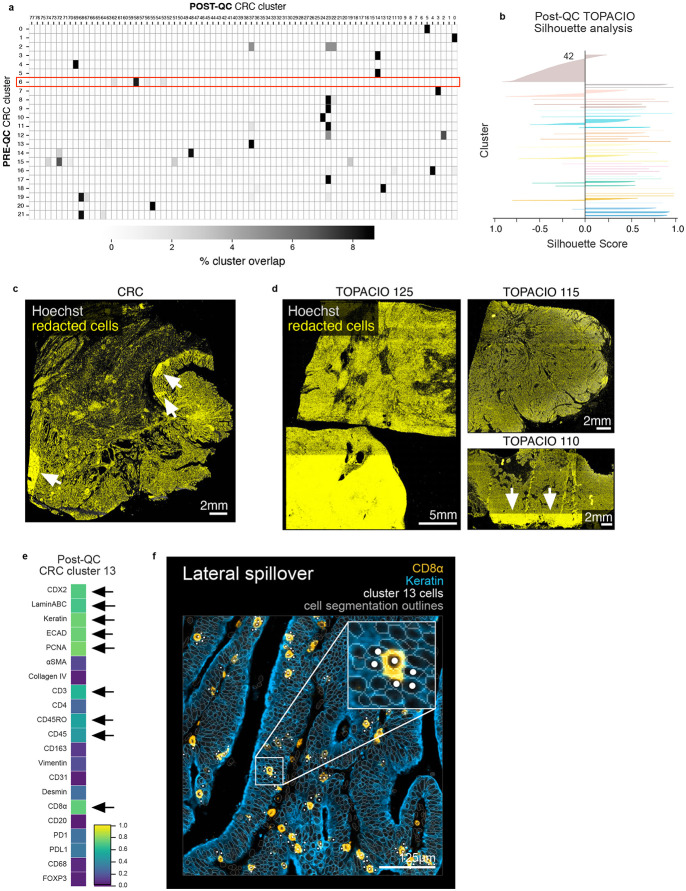
Extended Data Fig. 6 ∣. Overlap between pre- and post-QC CRC clusters, TOPACIO silhouette scores, tissue distribution of redacted cells, and demonstration of lateral spillover in post-QC CRC data.
a, Percent overlap between pre-QC CRC clusters (rows) and post-QC CRC clusters (columns) showing that several pre-QC clusters are in fact made up of multiple post-QC clusters (i.e., different cell types). b, Silhouette scores for post-QC TOPACIO clusters shown in Fig. 6b. Cluster 42 is an under-clustered population. c, Cells redacted by CyLinter from the CRC dataset demonstrating no discernable pattern (or bias) in the removal of cells from the image with the exception of select ROIs (highlighted by white arrows) used to remove focal artifacts. d, Cells redacted by CyLinter from three arbitrary samples from the TOPACIO dataset demonstrating no discernable pattern (or bias) in the removal of cells from the images with the exception of select ROIs (highlighted by white arrows) used to remove focal artifacts. e, Mean signal intensities for post-QC CRC cluster 13 cells. Black arrows point to bright channels. f, Post-QC CRC cluster 13 cells (white dots) shown in the context of the CRC image demonstrating later spillover between keratin+ tumor cells (blue) and CD8α+ T cells (orange). Nuclear segmentation outlines (translucent outlines) are shown for reference.

