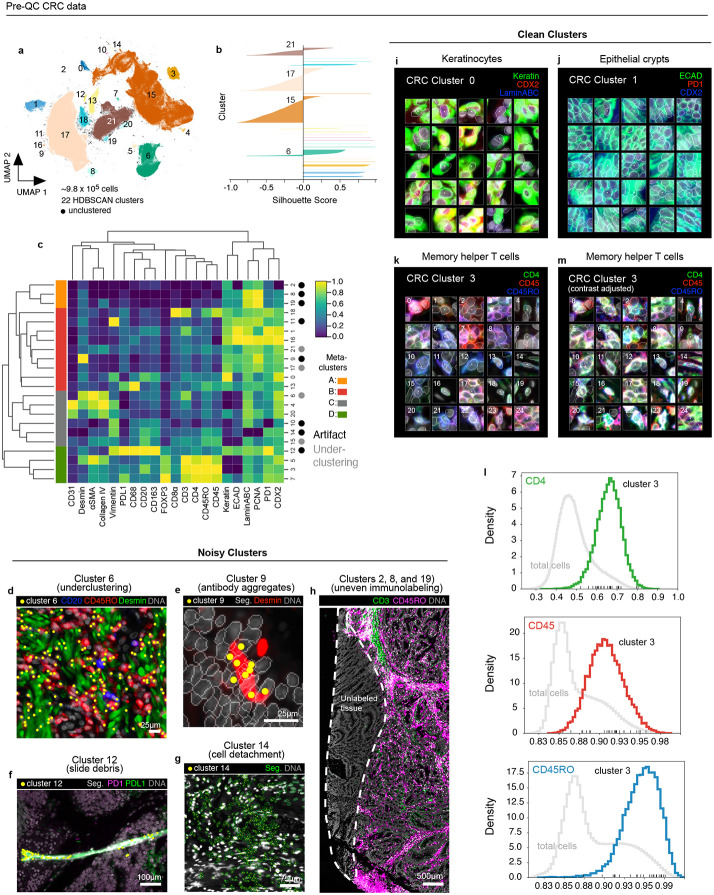
Fig. 2 ∣. Evaluation of pre-QC cell clustering results from the CRC dataset.
a, UMAP embedding of CRC data showing ~9.8 X 10⁵ cells colored by HDBSCAN cluster (numbered 0-21). Black scatter points represent unclustered (ambiguous) cells. b, Silhouette scores for CRC clusters shown in panel (a). Clusters 6, 15, 17, and 21 exhibit cells with negative silhouette scores indicative of under-clustering. c, CRC clustermap showing mean signal intensities of clustering cells normalized across clusters (row-wise). Four (4) meta-clusters defined by the clustermap dendrogram are highlighted. d, Cluster 6 cells (yellow dots) shown in a region of the CRC image demonstrating the co-clustering of distinct populations of B cells (CD20, blue), memory T cells (CD45RO, red), and stromal cells (desmin, green); Hoechst (gray) is shown for reference. e, Anti-desmin antibody aggregates (red) in a region of the CRC image. Yellow dots highlight cluster 9 cells which have formed due to this artefact; Hoechst (gray) shown for reference. f, Autofluorescent fiber in a region of the CRC image as seen in the PD1 (magenta) and PD-L1 (green) channels. Yellow dots highlight cluster 9 cells which have formed due to this artefact; Hoechst (gray) shown for reference. g, Cell detachment in a region of the CRC image as indicated by anucleate segmentation outlines (green). Yellow dots highlight cluster 14 cells which have formed due to this artefact; Hoechst (gray) shown for reference. h, Region of tissue at the bottom-left portion of the CRC image unexposed to anti-CD3e and anti-CD45RO antibodies used during imaging cycle 3 that led to the formation of CRC clusters 2, 8, and 19; Hoechst (gray) shown for reference. i-k, Top three most highly expressed markers (1: green, 2: red, 3: blue) for clusters 0 (keratinocytes, i), 1 (epithelial crypts, j), and 3 (memory helper T cells, k). A single white pixel at the center of each thumbnail highlights the reference cell. Nuclear segmentation outlines (translucent white outlines) and Hoechst (gray) are shown for reference. l, Density histograms of CD4 (green), CD45 (red), and CD45RO (blue) channels for cluster 3 cells superimposed on distributions of total cells as seen in the same channel (gray). Rugplots at the bottom of each histogram show where the 25 cluster 3 cells shown in panel (l) reside in each distribution. m, Cluster 3 cells shown in panel (l) after signal intensity cutoffs have been adjusted per image to improve their homogeneity of appearance.

