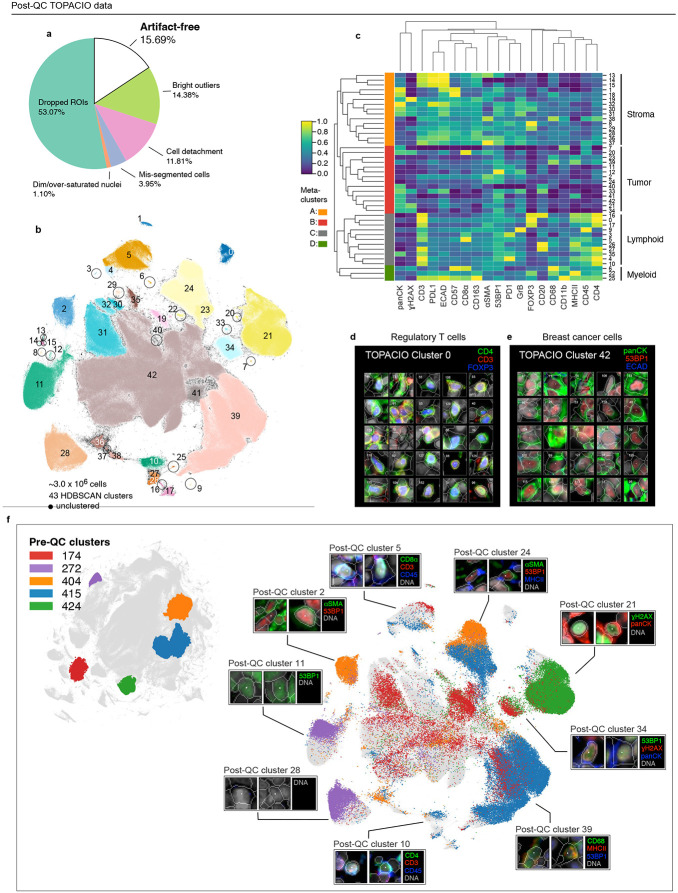
Fig. 6 ∣. Cleaning the TOPACIO Dataset with CyLinter.
a, Fraction of cells in the TOPACIO dataset redacted by each QC filter in the CyLinter pipeline. Dropped ROIs (cells dropped using the selectROIs module), Dim/over-saturated nuclei (cells dropped using the dnaIntensity module), mis-segmented cells (cells dropped using the areaFilter module), cell detachment (cells dropped using the cycleCorrelation module), bright/dim outliers (cells dropped used the pruneOutliers module), artifact-free (cells remaining after QC). b, UMAP embedding of TOPACIO data showing 2,970,240 cells colored by HDBSCAN cluster. Black scatter points represent unclustered (ambiguous) cells. c, TOPACIO clustermap showing mean signal intensities of clustering cells normalized across clusters (row-wise). Six (4) meta-clusters defined by the clustermap dendrogram at the left are highlighted. d-e, Top three most highly expressed markers (1: green, 2: red, 3: blue) for clusters 0 (regulatory T cells, d) and 42 (breast cancer cells, e). A single white pixel at the center of each image highlights the reference cell. Nuclear segmentation outlines (translucent outlines) and Hoechst (gray) are shown for reference. f, Left: Pre-QC TOPACIO UMAP embedding showing the location of five clusters selected at random. Right: location of those five random pre-QC clusters in the post-QC and their corresponding thumbnails, indicating multiple types of biologically extant cell states in the post-QC embedding.

