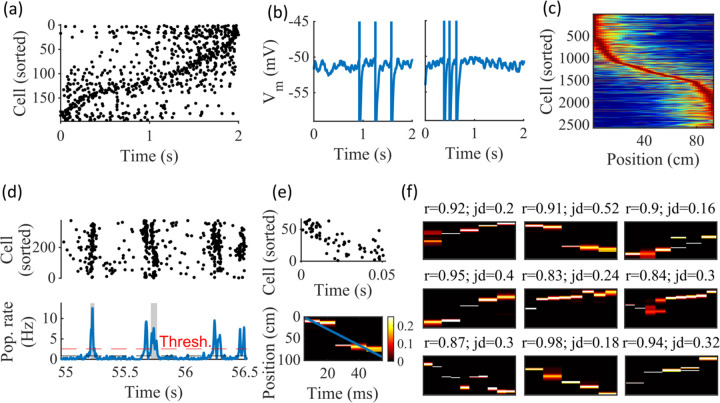
Figure 2: Spatially correlated reactivations in networks without environment-specific connectivity or plasticity.
(a-f) Example activity from the fiducial parameter set (15 clusters, mean cluster participation of 1.25). (a) Example raster plot from one place-field trial. Cells sorted by trial peak. (b) Example membrane traces from two of the cells in (a). (c) Place fields from 10 different networks generated from the same parameter set, sorted by peak location and normalized by peak rate. (d) Example raster plot (top) and population firing rate (bottom; blue line) showing preplay in a simulation of sleep. Horizontal dashed black line is the mean population rate across the simulation. Horizontal dashed red line is the threshold for detecting a population-burst event (PBE). PBEs that exceeded the threshold for at least 50 ms and had at least 5 participating cells were included in the preplay decoding analysis. Grey bars highlight detected events. (e) Example replay event (Top, raster plot. Bottom, Bayesian decoding of position). Event corresponds to the center event in (d). Raster includes only participating cells. The blue line shows the weighted correlation of decoded position across time. (f) Nine example decoded events from the same networks in (c). The width of each time bin is 10 ms. The height spans the track length. Same color scale as in (e). r is each event’s absolute weighted correlation. jd is the maximum normalized jump in peak position probability between adjacent time bins. The same event in (e) is shown with its corresponding statistics in the center of the top row. Preplay statistics calculated as in Farooq et al., 2019.

