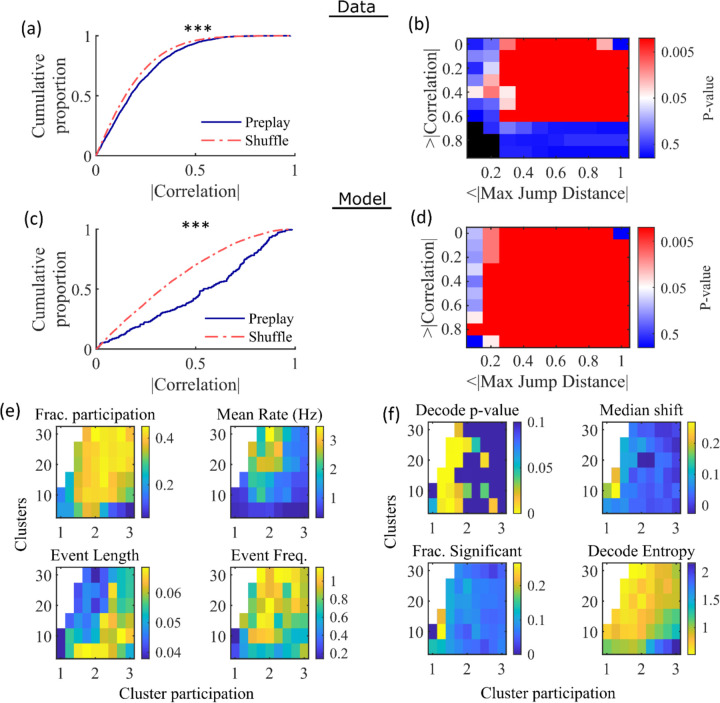
Figure 4: Preplay depends on modest cluster overlap.
(a,c) The cumulative distribution function (CDF) of the absolute weighted correlations for actual events (blue line) versus shuffled events (red dashed line) of experimental data from Shin at al., 2019 (a; KS-test, p=2×10⁻¹², KS-statistic=0.078) and simulated data (c; KS-test, p=3×10⁻¹⁶, KS-statistic=0.29) reveal results similar to those in Figure 1h of Farooq et al., 2019. *** p<0.001. (b,d) P-value grids (p-value indicated logarithmically by color) showing that the actual decoded events are higher quality sequences than shuffles across a wide range of quality thresholds for both experimental data from Shin et al., 2019 (b) and simulated data (d). For each point on the grid the fraction of events that exceed the absolute weighted correlation threshold (y-axis) and don’t exceed the maximum jump distance (x-axis) is calculated, and the significance of this fraction is determined by comparison against a distribution of corresponding fractions from shuffled events. Black squares indicate criteria that were not met by any events (either shuffled or actual). The panel is equivalent to Figure 1e of Farooq et al., 2019. (e) Network parameter dependence of several statistics quantifying the population-burst events. Top left, fraction of excitatory cells firing per event. Top right, mean excitatory cell firing rate (Hz). Bottom left, mean event duration (s). Bottom right, mean event frequency (Hz). Each point is the mean of data combined across all population-burst events of 10 simulated networks at each parameter point. Data from the same simulations as Figure 3. (f) Network parameter dependence of several statistics quantifying the Bayesian decoding. Top left, p-value of the absolute weighted correlations (from a KS-test as calculated in (c)). Top right, the shift in the median absolute weighted correlation of actual events relative to shuffle events. Bottom left, the fraction of events with significant absolute weighted correlations relative to the distribution of absolute weighted correlations from time bin shuffles of the event. Bottom right, the mean entropy of the position probability of all time bins in decoded trajectories.

