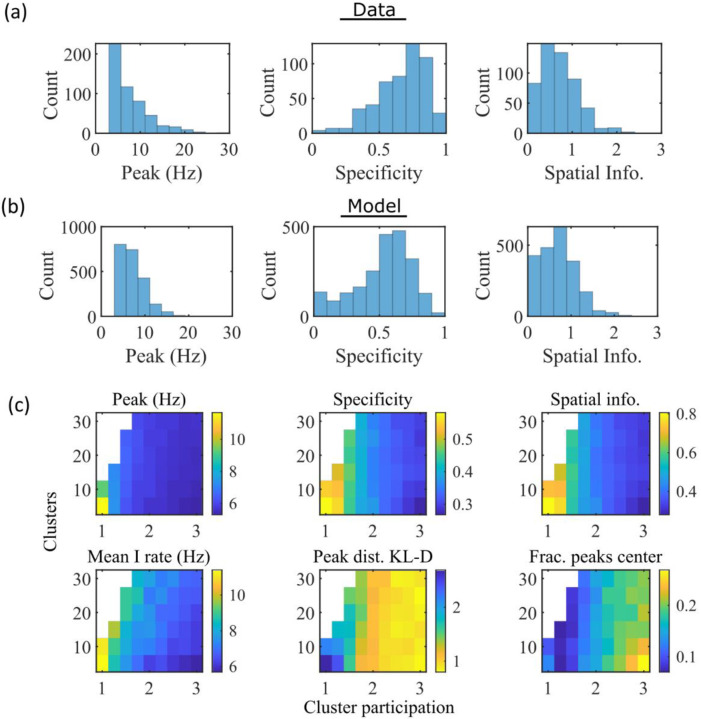
Figure 3: The model produces place fields with similar properties to hippocampal place fields.
(a) Place field statistics for hippocampal place fields recorded in rats upon their first exposure to a W-track (Shin et al., 2019). Left, place-field peak rate (Hz). Center, place-field specificity (fraction of track). Right, place-field spatial information (bits/spike). (b) Same as (a) but for place fields from a set of 10 simulated networks at one parameter point (15 clusters and mean cluster participation of 1.25). (c) Network parameter dependence of place-field statistics. For each parameter point, the color indicates the mean over all place fields from all networks. Top row: mean statistics corresponding to the same measures of place fields used in panels (a, b). Bottom left: mean firing rate of the inhibitory cells. Bottom center: the KL-divergence of the distribution of place-field peaks relative to a uniform spatial distribution. Bottom right: fraction of place-field peaks peaked in the central third of the track.

