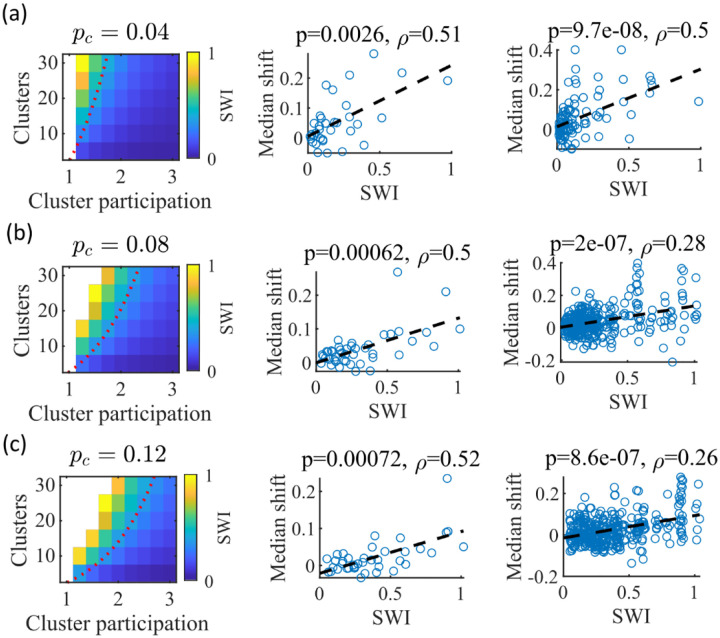
Figure 8: The Small-World Index of networks correlates with preplay quality.
(a-c) Left column, the Small-World Index (SWI; plotted as color) is affected by the global E-to-E connection probability, . Red dotted line indicates a contour line of . This boundary shifts downward as increases. Center column, across parameter points in the network parameter grid, SWI correlates with an increase in the median absolute weighted correlation of decoded trajectories relative to shuffles (e.g. this corresponds in Figure 4c to the rightward shift of the CDF of measured absolute weighted correlations relative to the shuffle events). Each point is produced by analysis of all events across 10 networks from one parameter point in the grid on the left. Right column, same as the center column but each point is data from each of the 10 individual networks per parameter set. P-value and correlation, , are calculated from Spearman’s rank-order correlation test. Dashed line is the least-squares fit. (a) Data from a parameter grid where the E-to-E connection probability was decreased by and the E-to-E connection strength was doubled from their fiducial values used in prior figures. (b) Data from the same parameter grid as Figures 3–5. (c) Data from a parameter grid where the E-to-E connection probability was increased by and the E-to-E connection strength scaled by two-thirds from their fiducial values.

