Figure 2:
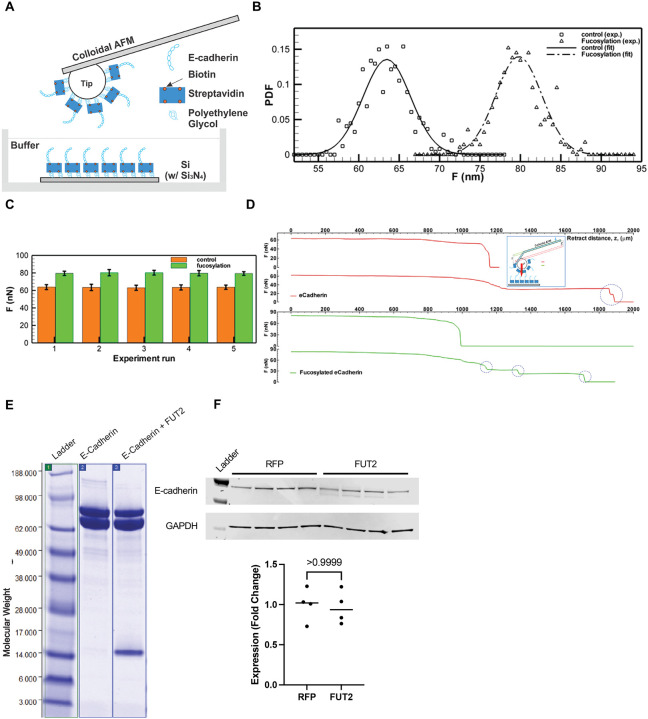
FUT2-fucosylated E-cadherin has higher bond strength than non-FUT2-fucosylated E-cadherin. A. Schematic of the experimental setup for AFM based nano-indentation measurements of e-cadherin with or without fucosylation. B. Probability Density Function (PDF) of maximum adhesion forces between e-cadherin filaments. Square: non-fucosylated e-cadherin. Delta: fucosylated e-cadherin. Lines: normal distribution fits for non-fucosylated (solid: , σ = 2.8585 nN) and fucosylated e-cadherin (dashed: , σ = 2.9432 nN) C. Bar graph showing mean maximum adhesion force (nN) of non-fucosylated (dark) and fucosylated (light) e-cadherin. Error bar: one standard deviation. Total five pairs of experimental runs are presented. (Each run contains ~100 measurements, Supplementary Table 1) D. Sample adhesion curve showing the maximum binding force and break-offs (cliffs, blue circle). Single (Row 1) and two (Row 2) break-offs of the bonded non-fucosylated e-cadherin filaments, while Row 3 & 4 show maximum & partial break-offs of the bonded fucosylated e-cadherin filaments. Inset: schematics of adhesion measurement using AFM. E. Immunoblot depicting the presence of N-terminal fragment of E-cadherin when co-expressed with FUT2. F. E-cadherin expression does not change with FUT2 overexpression.

