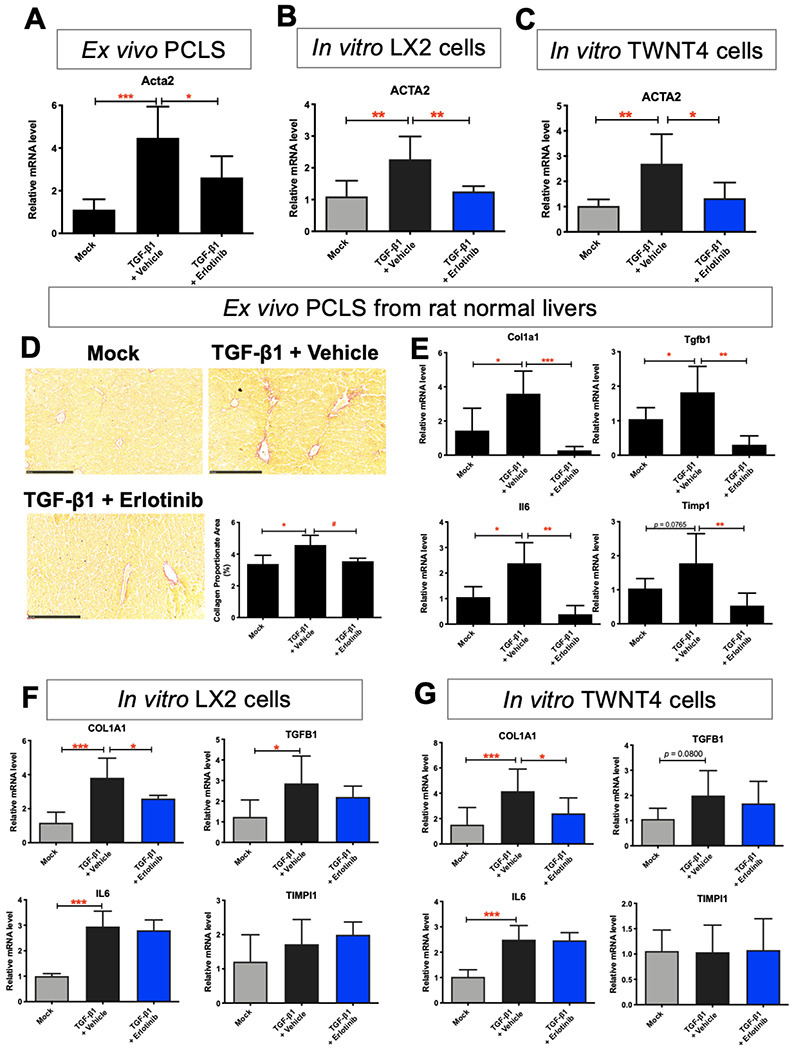
Figure 5. Comparison of antifibrotic evaluation in ex vivo HSCs from PCLS with in vitro HSCs.

Quantitative RT-PCR analysis of Acta2 mRNA from (A) PCLS from normal rats, (B) LX2 and (C) TWNT4 cells. PCLS or HSCs were activated with 10 ng/mL TGF-β1 for 24 hours, and further treated with 5 μM erlotinib for 72 hours. (D) Amount of collagen measured with Sirius red staining and quantified with collagen proportionate area analysis in PCLS from normal rats. Quantitative RT-PCR analysis of Il6, Tgfb1, Timp1 and Col1a1 mRNA from (E) PCLS from normal rats, (F) LX2 and (G) TWNT4 cells. These experiments were repeated three times (n = 4). All values were expressed as the mean ± S.E.M with one-way ANOVA analysis. Significance is represented by *p < 0.05, **p < 0.01, ***p < 0.001.
