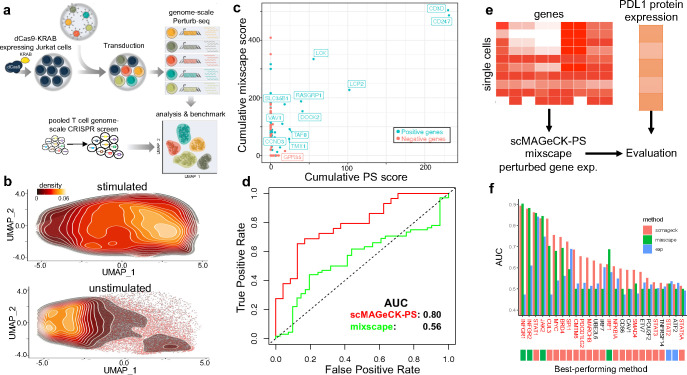
Figure 2. Additional benchmark results using genome-scale Perturb-seq and ECCITE-seq.
a, Benchmark procedure using a genome-scale Perturb-seq and a published, pooled T cell CRISPR screen. b, The distribution of unstimulated and stimulated Jurkat cells along the UMAP plot. c, The correlation of predicted scores by scMAGeCK-PS and mixscape. d, the Receiver-Operating Characteristic (ROC) curve of both methods in separating positive and negative hits. e-f, Benchmark using a published ECCITE-seq where PDL1 protein expression is used as gold standard (e), and the performance of different methods in terms of predicting PLD1 protein expression (f).

