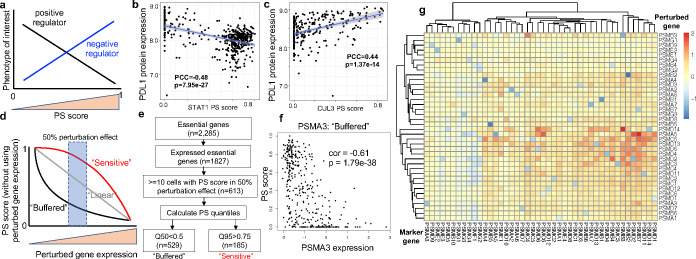
Figure 3. Dose-dependent responses of perturbations.
a, The correlation between a gene’s PS and a phenotype of interest indicates positive (or negative) regulations. b-c, The correlation between PDL1 protein expression and the PS of CUL3 (b) and STAT1 (c). CUL3 is a known negative regulator of PDL1, while STAT1 is a known positive regulator. d, The classification of buffered or sensitive genes, based on perturbed gene expression and PS. e, The classification of buffered or sensitive genes from published Perturb-seq datasets focusing essential genes in K56226. f, The perturbation-expression plot of PSMA3, a buffered gene. g, The log fold changes of mark gene expressions (columns) upon perturbing proteasome genes (rows) from the essential gene Perturb-seq dataset.

