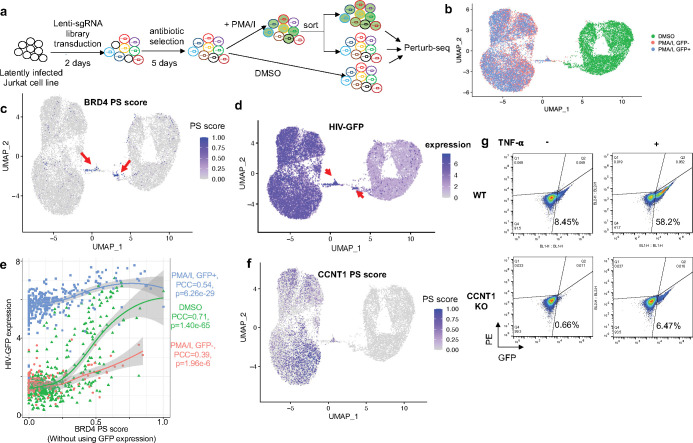
Figure 4. Perturb-seq on HIV latency.
a, The experimental design of Perturb-seq. b, The UMAP plot of single-cell transcriptome profiles. Cells are colored by three different conditions. c, The distribution of BRD4 PS. d, The expression of HIV-GFP. e, The correlations between HIV-GFP expression and BRD4 PS that does not use HIV-GFP as target gene. f, The distribution of CCNT1 PS. g, The protein expression of HIV-GFP in response to CCNT1 knockout in different cell states (TNF-alpha vs non-stimulated).

