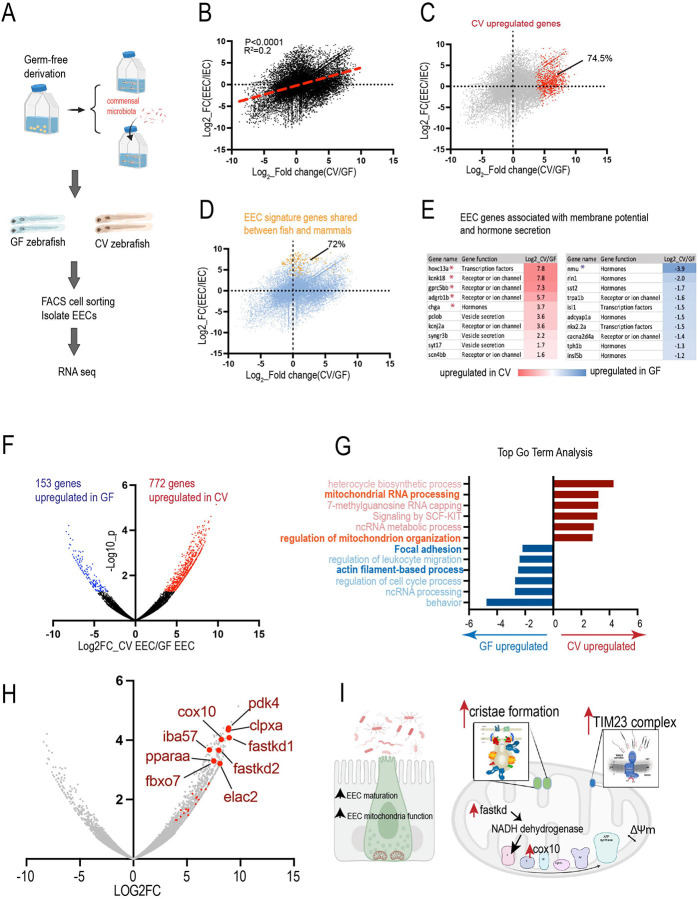
Figure 2. Gut microbiota promotes EEC maturation and mitochondrial function.
(A) Transcriptomic analysis of the FACS sorted EECs from GF and CV zebrafish. (B) Positive correlation between the genes that are upregulated in CV (X-axis) and the genes that are enriched in EECs (Y-axis). (C) Among the genes that are significantly upregulated in CV (red color), 74.5% are enriched in the EECs. (D) 72% of the EECs signature genes shared between zebrafish and mammals are upregulated in CV. (E) The differential expression of the EEC signature genes that encode hormone peptides or are involved in membrane potential in GF and CV conditions. * Indicates that the genes are significantly upregulated in the GF or CV conditions. (F) The volcano plot shows the genes that are significantly upregulated in CV or GF. (G) Go-term analysis of the CV or GF upregulated genes. (H) The volcano plot shows the genes that are involved in mitochondrial function. Many of the genes that are associated with mitochondrial regulation are among the most significantly upregulated genes in CV EECs. (I) The model figure shows that commensal microbiota colonization promotes EEC maturation and EEC mitochondrial function.

