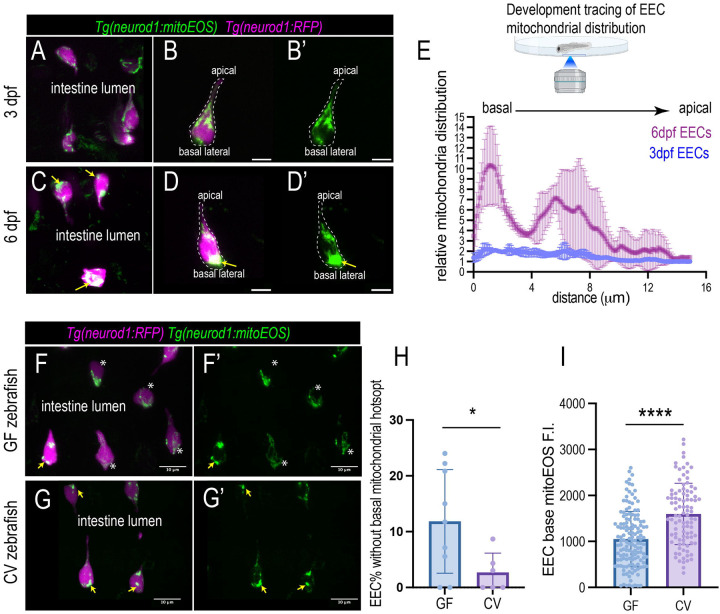
Figure 4. Commensal microbiota colonization promotes mitochondria accumulation at the EEC basal lateral membrane.
(A-D’) In vivo imaging to trace the EEC mitochondrial abundance and the intracellular mitochondria distribution in the same zebrafish. (A-B’) Confocal projections of the typical EECs at 3dpf zebrafish proximal intestine. (C-D’) Confocal projections of the typical EECs at 6dpf zebrafish proximal intestine. The mitochondria are labeled via the Tg(neurod1:mitoEOS), and the EECs are labeled via the Tg(neurod1:RFP). Note that at 3dpf, the mitochondria are evenly distributed in the EEC cytoplasm, and the mitochondria contents at the basal lateral membrane are low. At 6dpf, the mitochondria distribution exhibits a hot spot pattern. In most EECs, a spot at the basal lateral membrane (yellow arrows in C-D’) contains highly abundant mitochondria. (E) Quantification of the relative mitochondrial fluorescence intensity within the EECs in the same zebrafish at 3dpf and 6dpf. 5 representative EECs from the same 3dpf and 6dpf zebrafish were used to perform the data analysis. (G-H’) Confocal projections of the typical EECs in GF and CV zebrafish. Note that many EECs in GF zebrafish have low mitochondria contents at the basal lateral membrane (white stars in G and G’). Most EECs in CV zebrafish exhibit hot spot basal lateral membrane mitochondrial distribution patterns (yellow arrows in H and H’). (I) Quantification of the percentage of EECs without basal mitochondrial hotspots in 7dpf GF and CV zebrafish. Each dot represents an individual zebrafish. (I) Quantification of the mitochondrial fluorescence intensity at the basal membrane in 7dpf GF and CV zebrafish. Student T-test was used in H and I. * P<0.05, **** P<0.0001.

