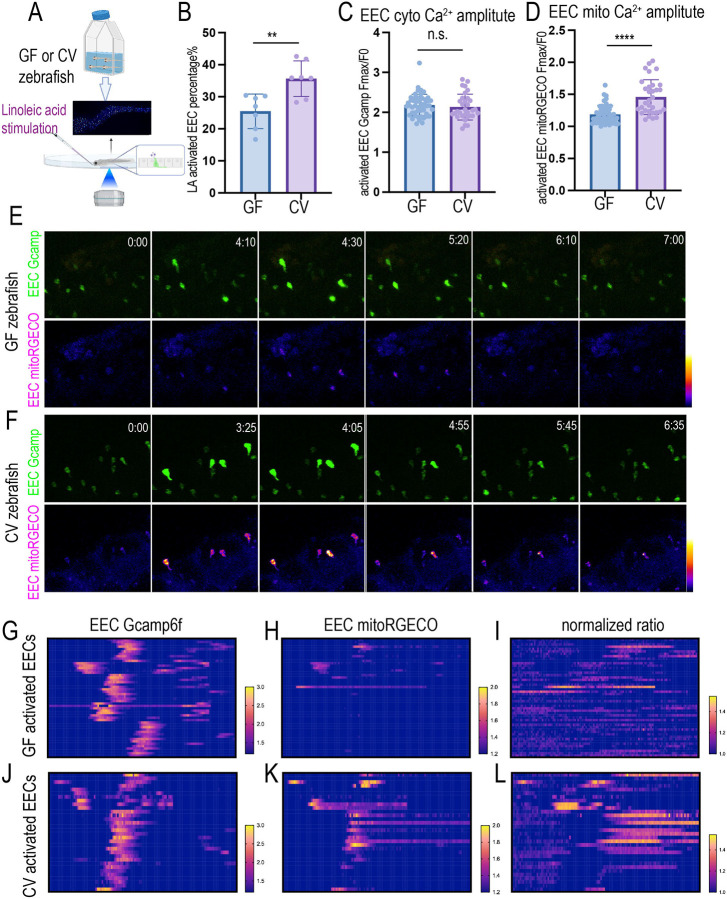
Figure 8. Nutrient induced EECs’ mitochondrial calcium increase requires commensal microbiota colonization.
(A) In vivo imaging to analyze the 7dpf GF and CV zebrafish EEC cellular and mitochondrial activity in response to linoleic acid stimulation. (B) Quantification of the percentage of EECs that are activated by linoleic acid in GF and CV zebrafish. Each dot represents an individual zebrafish. (C-D) Quantification of the linoleic acid-activated EEC cytoplasmic Ca2+ amplitudes and the mitochondrial Ca2+ amplitudes in GF and CV zebrafish. Each dot represents an individual EEC. Note that there is no significant change in the cytoplasmic Ca2+ increase. However, CV EECs exhibit a significantly higher mitochondrial Ca2+ increase in response to linoleic acid stimulation. (E-F) Time-lapse images of the representative EECs post linoleic acid stimulation in GF and CV zebrafish. The EEC cytoplasmic Ca2+ was labeled by Gcamp6f, and the EEC mitochondrial Ca2+ was labeled by mitoRGECO. (G-L) Analysis of the change of the EEC Gcamp6f fluorescence, EEC mitoRGECO fluorescence, and EEC mitoRGECO/Gcamp6f ratio in GF and CV zebrafish. Only the linoleic acid activated EECs were plotted. G & J, H & K, and I & J used the same heatmap scale. 32 activated EECs from 4 CV zebrafish and 50 activated EECs from 5 GF zebrafish were analyzed.

