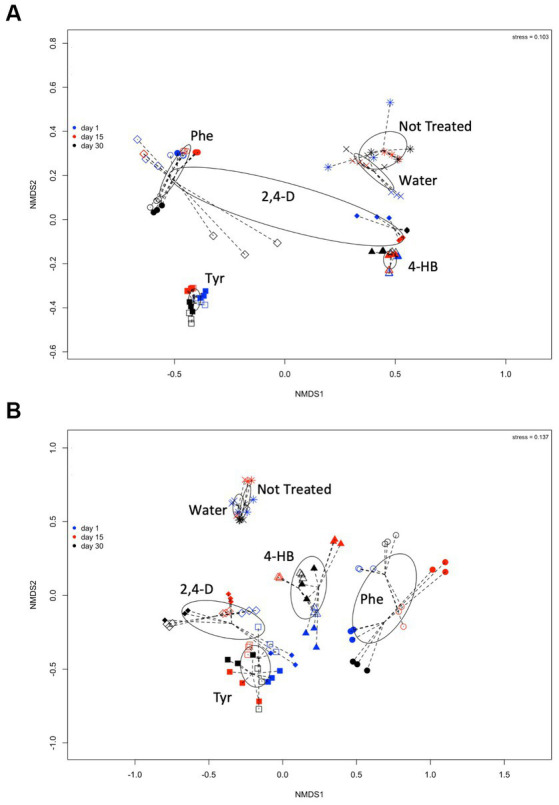
Figure 3.

Comparisons of (A) archaeal and (B) bacterial community composition from saline soil microcosm experiments assessed by non-metric multidimensional scaling of MspI-terminal restriction fragment length polymorphisms (T-RFLP) of the 16S rRNA gene analysis. Each symbol corresponds to a single T-RFLP profile representing one of the three replicates from a single community structure at day 1 (blue symbols), day 15 (red symbols), and day 30 (black symbols), exposed to 5 mM (open diamonds) or 20 mM (solid diamonds) 2,4-D; to 5 mM (open triangles) or 20 mM (solid triangles) 4-HB; to 5 mM (open circles) or 20 mM (solid circles) Phe, and 5 mM (open squares) or 20 mM (solid squares) Tyr. T-RFLP profiles from microcosm controls without treatment (*) or without aromatic compound, water-only treatment (x), are also shown. Ellipses and lines were drawn using ordiellipse and ordispider functions from the vegan package.
