Fig. 4:
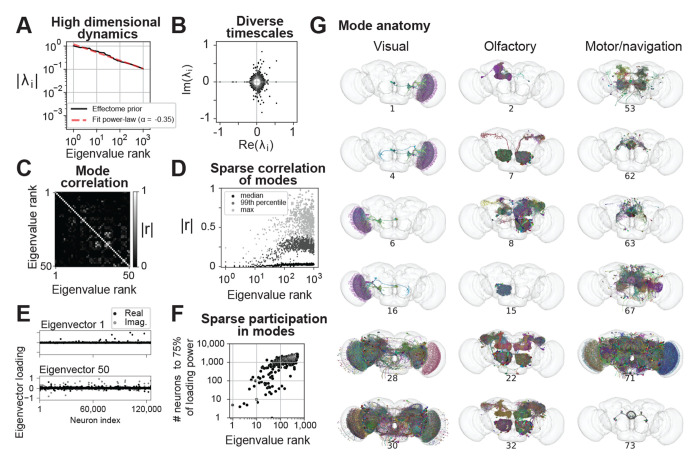
Putative global dynamical properties of the central fly nervous system. (A) Magnitude of top 1000 eigenvalues of the putative effectome (scaled matrix of signed synaptic counts extracted from the connectome, black) and power-law fit (dashed grey). (B) Eigenvalues plotted in the complex plane. (C) Correlation of eigenvectors sorted by associated eigenvalue magnitude. (D) Median (black), 99th percentile (gray), and maximum (light grey) correlation between each eigenvector and all other top 1000 eigenvectors, showing that the first 10-20 eigenvectors are nearly orthogonal to other eigenvectors and the correlation between other eigenvectors is highly sparse. (E) Per-neuron eigenvector loadings for the first (top) and 50th (bottom) eigenvector. (F) Concentration of eigenvector loadings, quantified by the number of neurons needed to account for 75% of the eigenvector’s power. (G) Anatomical renderings of neurons needed to account for 75% of the eigenvector’s loading power. Eigenvectors drawn from the top 100, and each column displays eigenvectors with neurons predominantly associated with either visual, olfactory, or motor/navigation anatomical locations.

