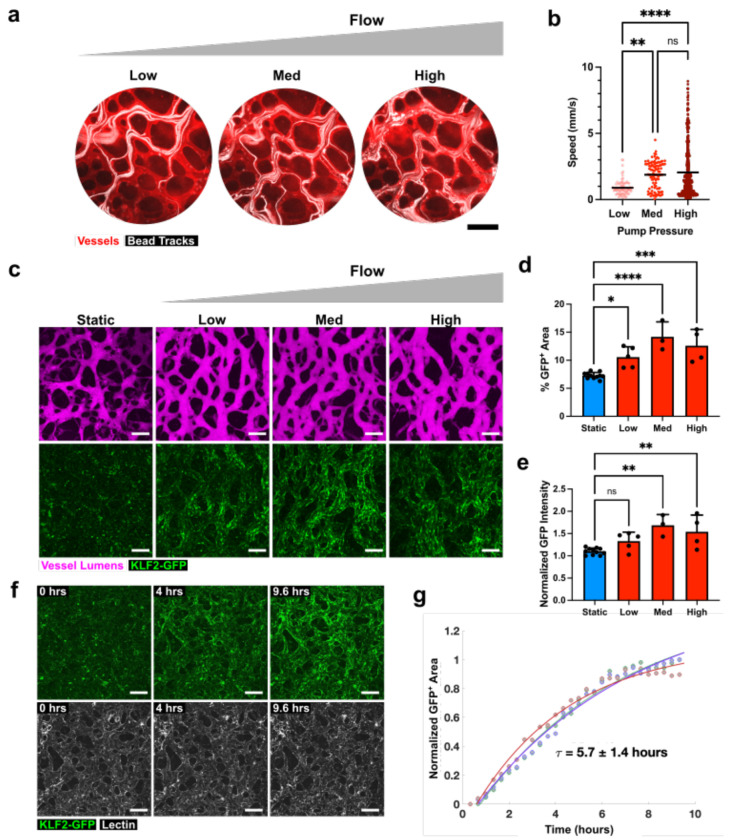
Figure 2. Characterization of flow levels and time course in engineered MVN system.
a Paths of fluorescent beads (white) in MVN (stained with red lectin) as pressure is increased in the pumping chamber. Scale bars = 200 μm. Each image represents a projection of bead location over 30 seconds. “Low”, “Med”, and “High”, correspond to application of 3 kPa, 6 kPa, and 9 kPa pressure, respectively, in the pumping chamber. b Average bead velocities for range of pressures in the pumping chamber, calculated from images of bead velocities (n = 3 samples, with 14-45 bead paths per sample). c Examples of MVNs, visualized after perfusion with fluorescent dextran (magenta), and their KLF2-GFP expression (green) under static conditions or after 48 hours of flow at the range of flow rates characterized in b. Scale bars = 200 μm. d Percent of total imaging area with KLF2-GFP signal. e KLF2-GFP signal intensity normalized to lowest intensity static sample. f Time series of z-stack confocal image projections of MVNs after the start of flow corresponding to medium pressure and acquired every 20 minutes. Samples were stained with lectin (white) to outline vessels. Scale bars = 200 μm. g Time course of KLF-GFP expression in MVNs after initiation of flow. GFP+ area for different regions in the MVN was modeled by an exponential fit and an average time constant for KLF2-GFP activation was calculated. τ is reported as mean ± standard deviation for 3 regions of interest. Data in b, d, and e reports mean and standard deviation from n = 3-11 MVNs. * indicates p<0.05, ** indicates p<0.01, *** indicates p<0.001, **** indicates p<0.0001, and ns indicates p>0.05.

