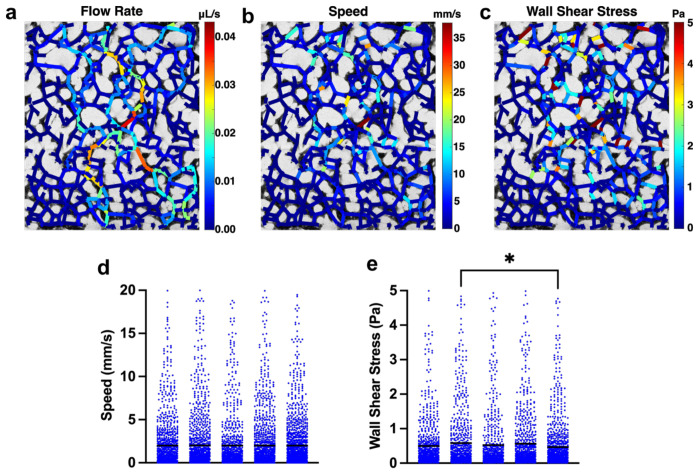
Figure 3. Estimates of wall shear stress in MVNs.
a Map of flow rate in each branch of MVN. b Map of speed in each branch of MVN. c Map of wall shear stress in each branch of MVN. d Flow speeds in each branch of 5 individual MVNs. e Wall shear stresses in each branch of 5 individual MVNs. Each point in d and e represent an independent vessel branch and each column represents an independent MVN. Horizontal black lines indicate mean value for the MVN. * indicates p<0.05. All other comparisons between MVNs in d and e were not statistically significant.

