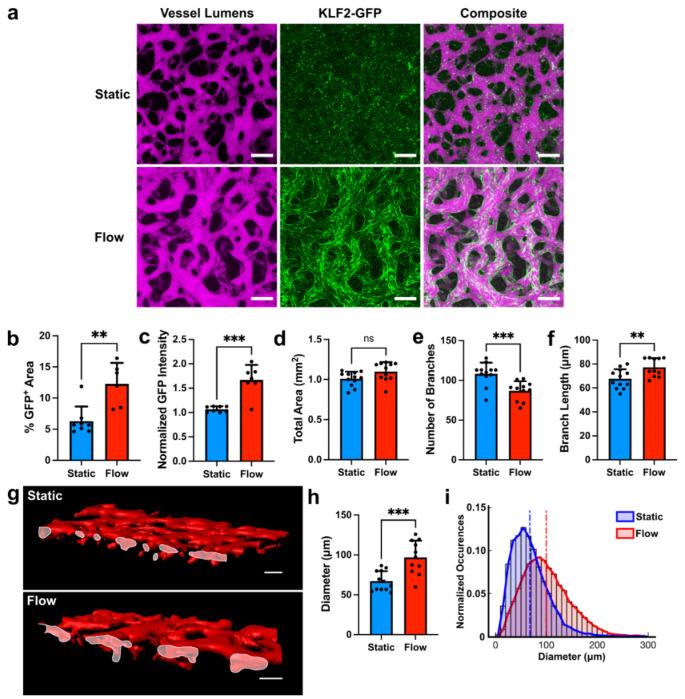
Figure 4. Flow-induced changes in vascular geometry.
a MVNs cultured under static (top) or flow (bottom) conditions. Vessels were perfused with fluorescent dextran (magenta) to visualize the intravascular space. MVNs cultured under flow expressed the KLF2-GFP reporter (green). Scale bars = 200 μm. b Percent of total imaging area with KLF2-GFP signal. c KLF2-GFP signal intensity normalized to lowest intensity static sample. d-f Number of branches, total area covered by vessels, and average branch length in MVNs. g Surface reconstruction of static MVNs (top) and MVNs under flow (bottom) cut across the xz plane to show vessel openings (outlined in white). h Average branch diameter in MVNs. i Distribution of vascular diameters in MVNs cultured under static (blue) and flow (red) conditions. Vertical dashed lines indicate average diameters across all samples in each group. In panels b-f and h, n=11-12 MVNs per group. ** indicates p<0.01, *** indicates p<0.001, and ns indicates p>0.05.

