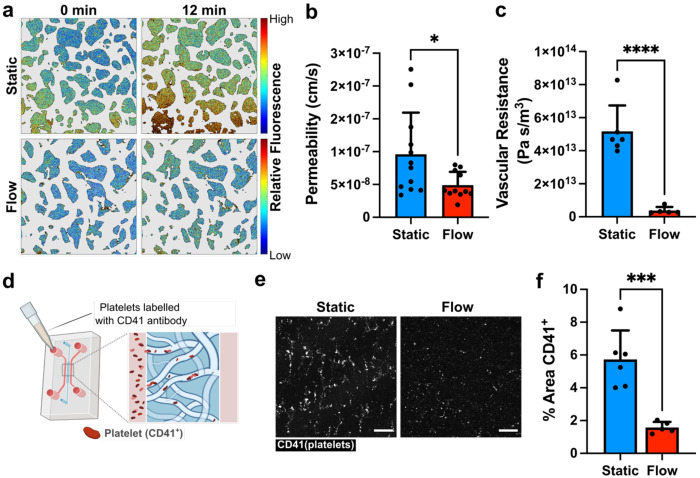
Figure 6. Flow-induced changes in vascular function.
a Heat maps of extravascular fluorescence in MVN cultured under static (top row) and flow (bottom row) conditions immediately after vascular perfusion with fluorescent dextran (left) and after 12 minutes (right). Scale bars = 200 μm. b Vascular permeability in MVNs cultured under static conditions or after 48 hours of flow (n=11-12 per group). c Total vascular resistance of MVNs cultured under static conditions or after 48 hours of flow (n=5-6 per group). d Schematic of experimental design for introducing platelets into MVNs. e Volume projections of CD41-labelled platelets (white) in MVNs. Networks were cultured under static conditions or exposed to flow for 68 hours prior to addition of platelets in the networks. Scale bars = 200 μm. f Percent of image area covered by CD41-labelled platelets in MVN devices (n=5-6 per group). * indicates p<0.05, *** indicates p<0.001, and **** indicates p<0.0001.

