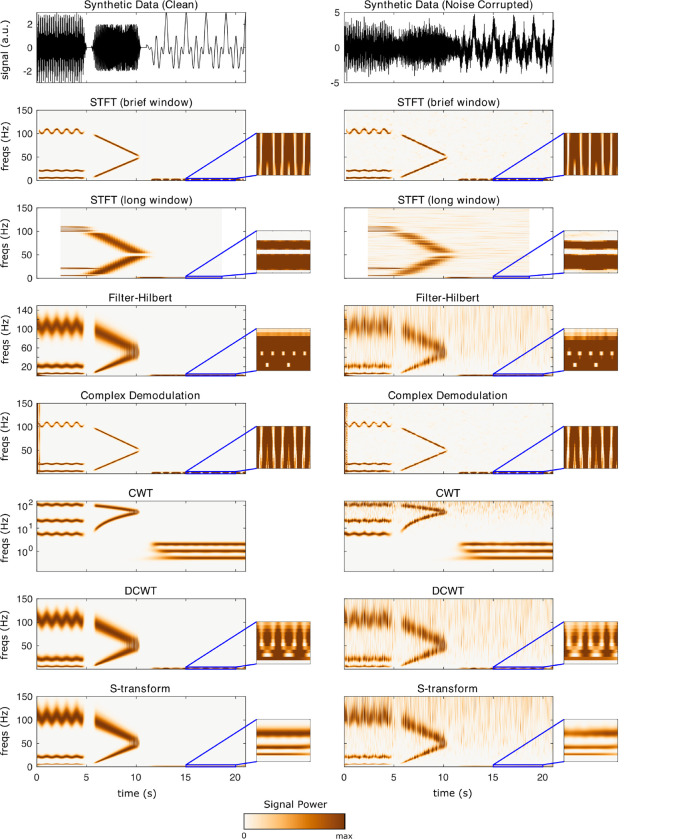
Figure 2:
Results of linear TF transformations on synthetic data. Left column is for an uncorrupted time-domain signal, right column is the output for the same signal corrupted with noise. Callouts show the result zoomed into 0–3 Hz and 15–20 seconds, to visualize resolution for the 0.5, 1, and 2-Hz waves. Note that CWT is shown on a logarithmic scale; this logarithmic frequency spacing is part of the CWT’s definition.

