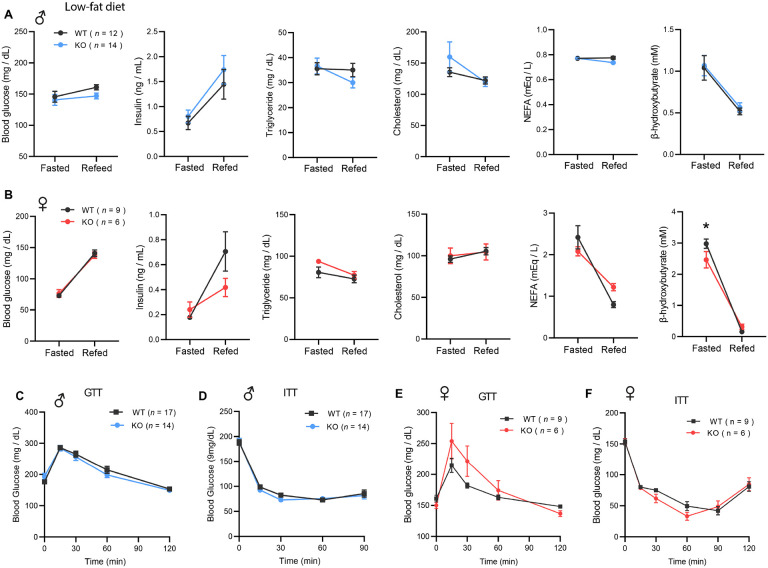
Figure 3. Ctrp10-KO mice fed a low-fat diet have normal fasting-refeeding response and glucose homeostasis.
(A-B) Overnight fasted and refed blood glucose, serum insulin, triglyceride, cholesterol, non-esterified free fatty acids (NEFA), and β-hydroxybutyrate levels in male (A) and female (B) mice. (C-D) Blood glucose levels during glucose tolerance tests (GTT; C) and insulin tolerance tests (ITT; D) in WT (n = 17) and KO (n = 14) male mice at 12 weeks of age. (E-F) Blood glucose levels during glucose tolerance tests (GTT; E) and insulin tolerance tests (ITT; F) in WT (n = 9) and KO (n = 6) female mice at 20 and 21 weeks of age, respectively. All data are presented as mean ± S.E.M. * P < 0.05 (two-way ANOVA with Sidak’s post hoc tests).

