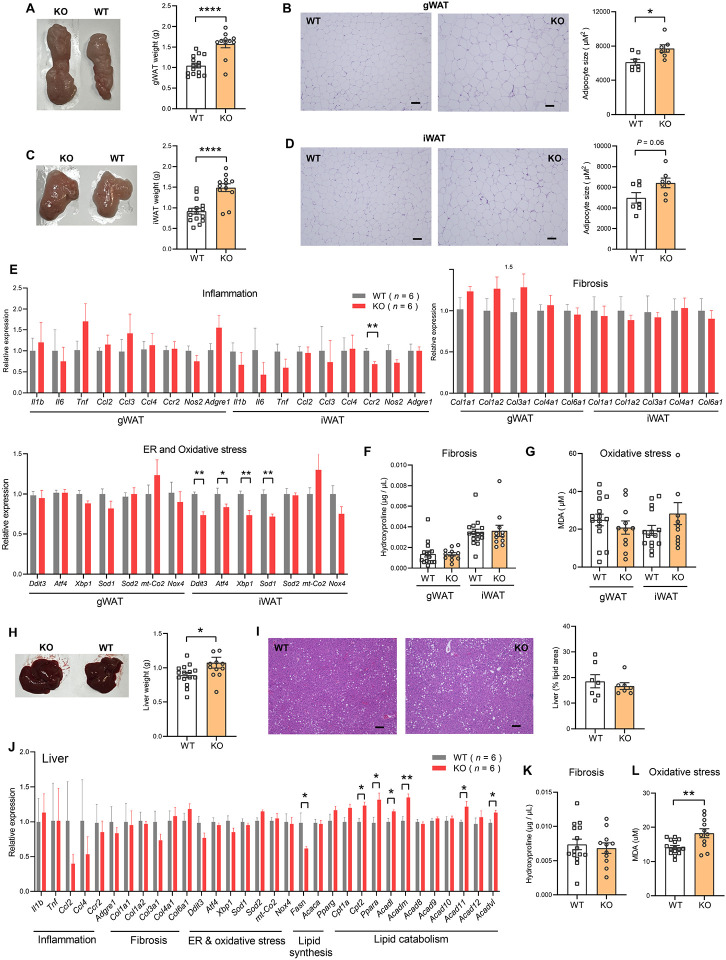
Figure 7. Ctrp10-KO female mice fed a HFD do not develop adipose tissue dysfunction and fatty liver.
(A) Representative images of dissected gonadal white adipose tissue (gWAT) and the quantification of gWAT weight in WT (n = 15) and KO (n = 12) female mice fed a HFD for 14 weeks. (B) Representative H&E stained histological sections of gWAT and the quantification of adipocyte cell size (n = 7 per genotype). Scale bar = 100 μM. (C) Representative images of dissected inguinal white adipose tissue (iWAT) and the quantification of iWAT weight in WT (n = 15) and KO (n = 12) female mice. (D) Representative H&E stained histological sections of iWAT and the quantification of adipocyte cell size (n = 7 per genotype). Scale bar = 100 μM. (E) Expression of genes associated with inflammation, fibrosis, ER and oxidative stress in gWAT and iWAT of WT (n = 6) and KO (n = 6) female mice fed a HFD for 14 weeks. Gene expression data were obtained from RNA-seq. (F-G) Quantification of hydroxyproline (marker of fibrosis) and malondialdehyde (MDA; marker of oxidative stress) in gWAT and iWAT. WT, n = 15; KO, n = 11. (H) Representative images of dissected liver and the quantification of liver weight in WT (n = 15) and KO (n = 12) female mice. (I) Representative H&E stained histological sections of liver and the quantification of hepatic lipid content (% lipid area; n = 7 per genotype). Scale bar = 100 μM. (J) Hepatic expression of genes associated with inflammation, fibrosis, ER and oxidative stress, lipid synthesis, and lipid catabolism in WT and KO female mice. Gene expression data were obtained from RNA-seq. (K-L) Quantification of hydroxyproline (marker of fibrosis) and malondialdehyde (MDA; marker of oxidative stress) in liver. WT, n = 15; KO, n = 11. All data are presented as mean ± S.E.M. * P < 0.05; ** P < 0.01.

