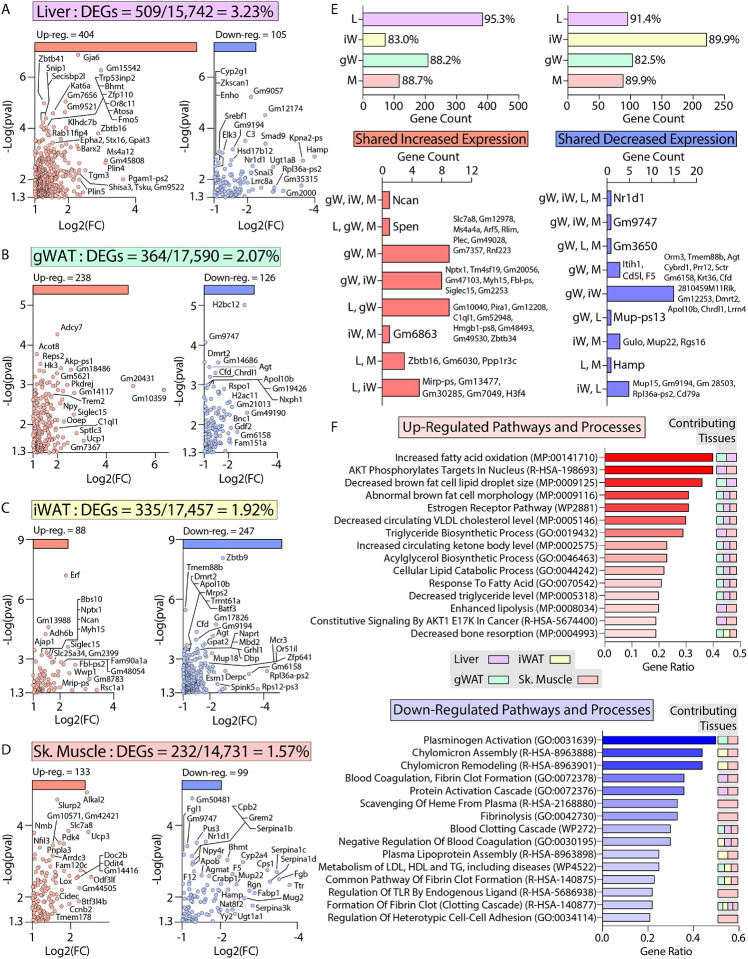
Figure 8. Transcriptomic analysis of liver, adipose tissue, and skeletal muscle of female Ctrp10 KO mice fed a high-fat diet.
(A-D) Cropped volcano plot views of all differentially expressed genes (DEGs, Log2(Fold Change) >1 or <−1 with a p-value <0.05) of the liver, gonadal white adipose tissue (gWAT), inguinal WAT (iWAT), or skeletal muscle (gastrocnemius). (E) Overlap analysis of tissue DEGs showing (top panel) expression unique to gonadal white adipose tissue (gW), inguinal white adipose tissue (iW), liver (L), or skeletal muscle (M). Percent (%) represents percent DEGs unique to each tissue. Bottom panel show DEGs shared across multiple tissues, with all the shared DEGs listed. (F) Enrichr analysis (129) of biological pathways and processes significantly (p<0.01) affected across the CTRP10 deficient female mice. Top pathways and processes derived from Gene Ontology (GO), Reactome (R-HAS), WikiPathway human (WP), and mammalian phenotype (MP). All up- or down-regulated DEGs across all tissues were used for analysis. The tissues contributing to the highest ranked pathways and processes are specified. n = 6 KO and 6 WT for RNA-seq experiments.

