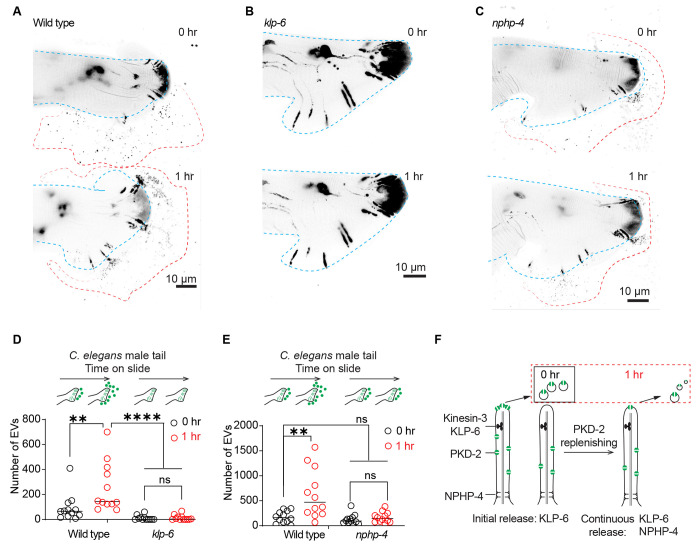
Figure 3. Continued PKD-2 ciliary EV release relies on effective replenishment of PKD-2 at the ciliary tip.
(A-C) Representative images of PKD-2::GFP ciliary EV release in male tail of wild-type, klp-6, and nphp-4 males.
(D) Quantification of EV counts from wild-type and klp-6 mutant males in the tail regions at 0 and 1 hour. The scatter plot with lines indicates the mean ± SEM. Each data point represents the total EV count released by an individual C. elegans male.
(E) Quantification of EV counts from wild-type and nphp-4 mutant males in the tail regions at 0 and 1 hour. The scatter plot with lines indicates the mean ± SEM. Each data point represents the total EV count released by an individual C. elegans male.
For D-E, statistical analysis was performed by two-way ANOVA with Bonferroni correction. n = 12-15 animals per genotype. ns denotes not significant, * denotes p < 0.05, and ** denotes p < 0.01., **** p<0.0001.
(F) Model of PKD-2 ciliary EV dynamics. NPHP-4 regulates the release of PKD-2::GFP ciliary EVs by replenishing PKD-2::GFP in the ciliary membrane. Meanwhile, KLP-6 controls ciliary PKD-2 EV release by concentrating PKD-2 at the ciliary tip. The sustained release of PKD-2 ciliary EVs over an hour necessitates the replenishment of PKD-2 in both the ciliary membrane and tip.
See also Figure S2.

