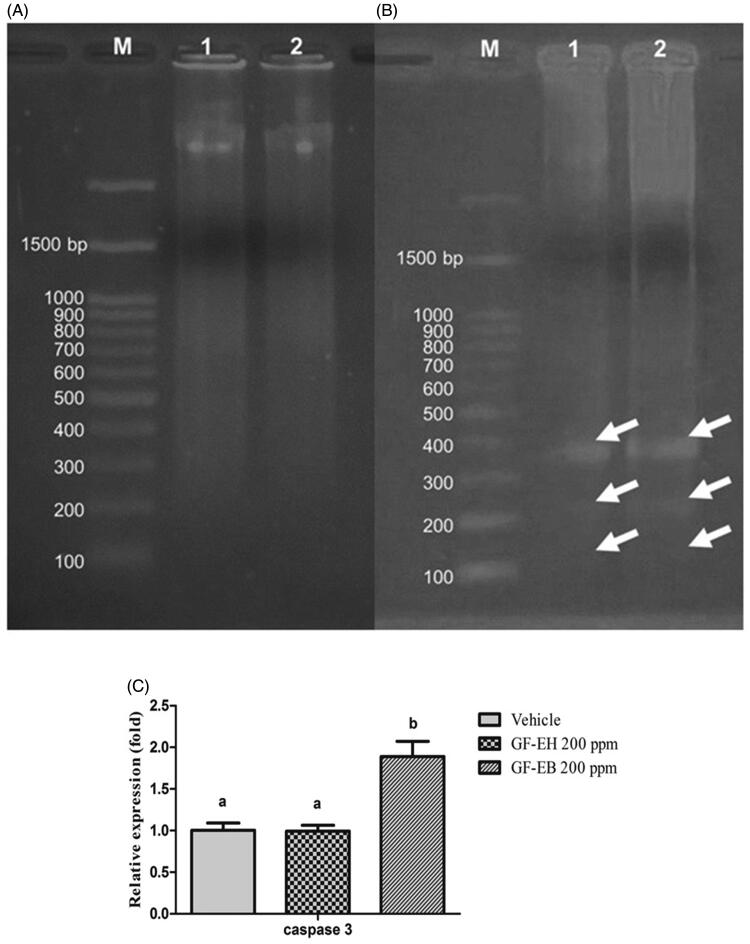
Figure 3.
DNA and RAN analysis of DU145 cells after treated with G. formosanum extracts. (A) DNA fragmentation analysis of DU145 cells treated with GF-EH (200 ppm) and (B) cells treated with GF-EB (200 ppm) (white arrow indicates the DNA fragmentation). M stands for Marker, and lanes 1 and 2 stands for G. formosanum extracts; (C) Relative caspase 3 gene expression of DU145 treated with or without 200 ppm G. formosanum extracts for 48 h. Significant difference (p < 0.05) between various groups is presented as (B).

