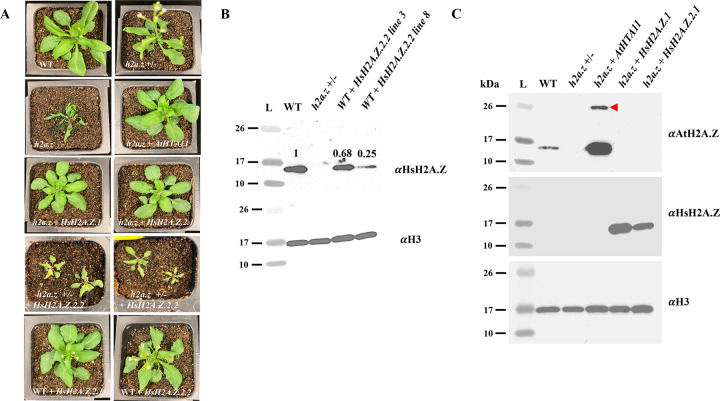
Figure 2. Human H2A.Z.1 and H2A.Z.2.1, but not H2A.Z.2.2, rescue phenotypic defects of crispr-generated h2a.z null plants.
(A) 2.5 weeks old WT and mutant plants were grown under long-day conditions and individually photographed. (B) Western-blot analysis of leaf chromatin extracts from wild type (WT), h2a.z +/−, and two WT plants transformed with human HsH2A.Z.2.2, were probed with plant specific H2A.Z antibody (top panel) while H3 antibody was used as a loading control (bottom panel). The numbers above the H2A.Z western bands represent the ratio of signal intensities between the H2A.Z band and the corresponding H3 band, where the ratio for the WT plant is set to 1. The signal intensities were quantified using ImageJ. (C) Western-blot analysis of leaf chromatin extracts from wild type (WT), h2a.z +/−, and transgenic plants, were probed with either plant specific (top panel), or human-specific (middle panel) H2A.Z antibodies. H3 antibody was used as a loading control (bottom panel). The red arrowhead points to a 26 kDa monoubiquitinated form of Arabidopsis HTA11 detected in h2a.z + AtHTA11 transgenic plants.

