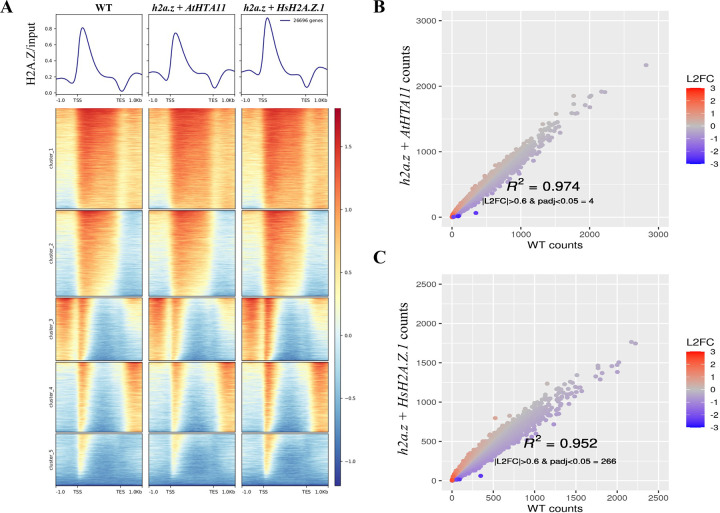
Figure 3. Chromatin immunoprecipitation with sequencing (ChIP-seq) analysis reveals that human H2A.Z.1 restores H2A.Z deposition sites in h2a.z plants.
(A) Heatmap of normalized ChIP-seq signal (H2A.Z/input) for 26,669 genes. Average ChIP-seq H2A.Z profiles of WT, h2a.z + AtHTA11, and h2a.z + HsH2A.Z.1 plants were plotted over gene body coordinates of 26,669 genes, from the transcript start site (TSS) to the transcript end site (TES) and +/− 1 kb from each end. Five k-means clusters were sorted by mean signal value. One replicate is used as a representative of each genotype. (B and C) Correlation of H2A.Z ChIP-seq read counts at genes between WT and h2a.z + AtHTA11 plants (B), and between WT and h2a.z + HsH2A.Z.1 plants (C). Read counts at genes were defined by mapped reads from the TSS to the TES. Counts were normalized via DESeq2. Color represents log2 fold change of normalized counts in sample vs WT.

