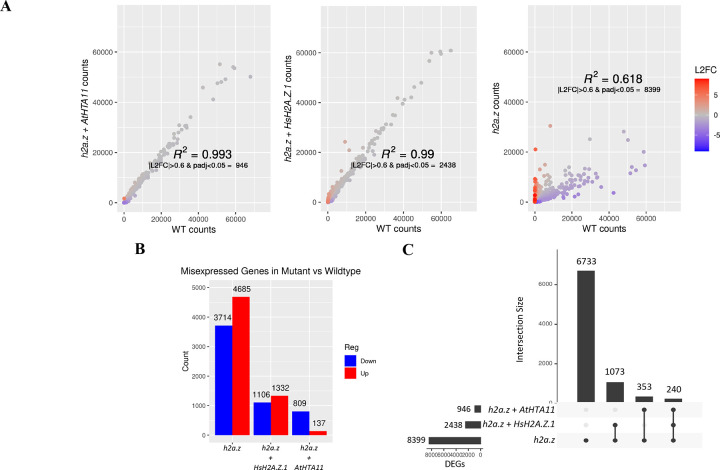
Figure 4. RNA-seq analysis reveals that human H2A.Z.1 restores the expression of more than 84% of misregulated genes in h2a.z plants back to WT levels.
(A) Correlation of DESeq2 normalized transcript counts per gene between WT and h2a.z + AtHTA11 plants (left), WT and h2a.z + HsH2A.Z.1 plants (middle), and between WT and h2a.z plants (right). Color represents log2 fold change of normalized counts per gene in sample vs WT. (B) Histogram representing total number of misexpressed genes in mutant and transgenic plants versus WT. (C) Upset plot of shared differentially expressed genes across h2a.z + AtHTA11, h2a.z + HsH2A.Z.1, and h2a.z plants compared to WT. Differential expression is defined by |L2FC| > 0.6 and padj < 0.05.

