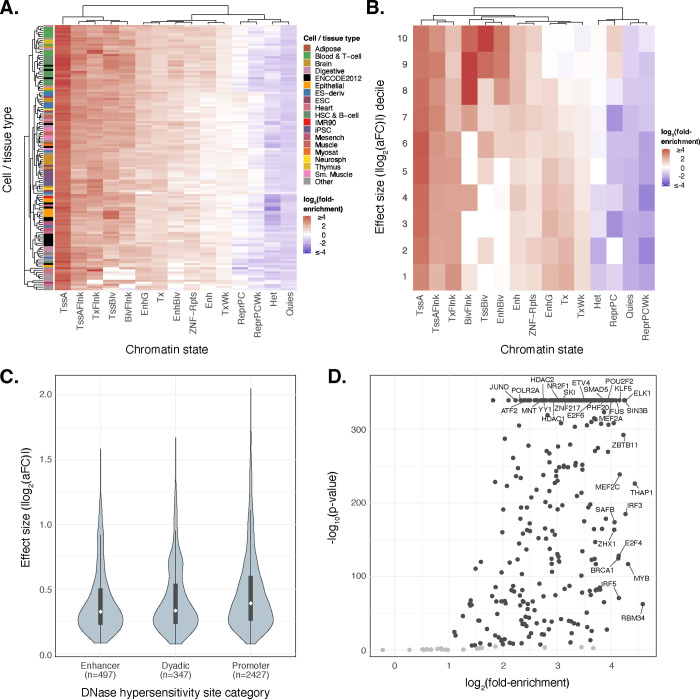
Figure 4. Fine-mapped cis-eQTLs are strongly enriched in regulatory regions across multiple cell/tissue types.
(A) A heatmap representing hierarchical clustering of the enrichment of cis-eQTLs in predicted chromatin states using the Roadmap Epigenomics 15-state chromHMM model across 127 cell-tissue samples. (B) Enrichment analysis of the decile partitioned eQTL effect sizes measured as base-2 logarithm of the the absolute value of the estimated allelic fold change (|log2(aFC)|) across 15 different chromatin states predicted by chromHMM model specific to LCLs (Lymphoblastoid Cell Lines). (C) Distribution of absolute value of lead cis-eQTL effect sizes measured as log2(aFC) across putatively active chromatin states of LCLs linked to multi-tissue DNAse Hypersensitivity Sites. (D) Enrichment analysis of lead cis-eQTLs at TFBS (Transcription Factor Binding Sites) from ENCODE’s ChIP-seq binding profiles. Scatter data points with p-values < 0.001 (Bonferroni corrected) and log2(fold-enrichment) > 1 are colored in black underscoring those transcription factors where lead cis-eQTL enrichment is both statistically significant and of notable magnitude.

