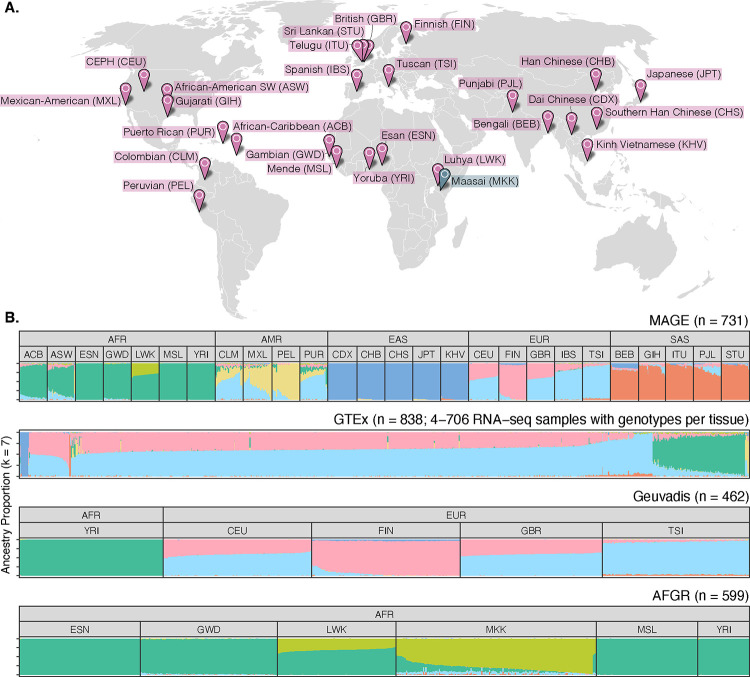
Figure 1. A globally diverse transcriptomics data set.
(A) RNA-seq data was generated from lymphoblastoid cell lines from 731 individuals from the 1000 Genomes Project11, roughly evenly distributed across 26 populations and five continental groups. Populations included in MAGE are colored in pink, while the Maasai population is colored in blue as it is present in the AFGR12 data set (based on sequencing of HapMap13 cell lines), but not in the 1000 Genomes Project or MAGE. (B) ADMIXTURE14 results displaying proportions of individual genomes (columns) attributed to hypothetical ancestry components. For MAGE, Geuvadis6, and AFGR, samples are stratified according to population and continental group labels from the respective source projects, while GTEx15 does not include population labels.

