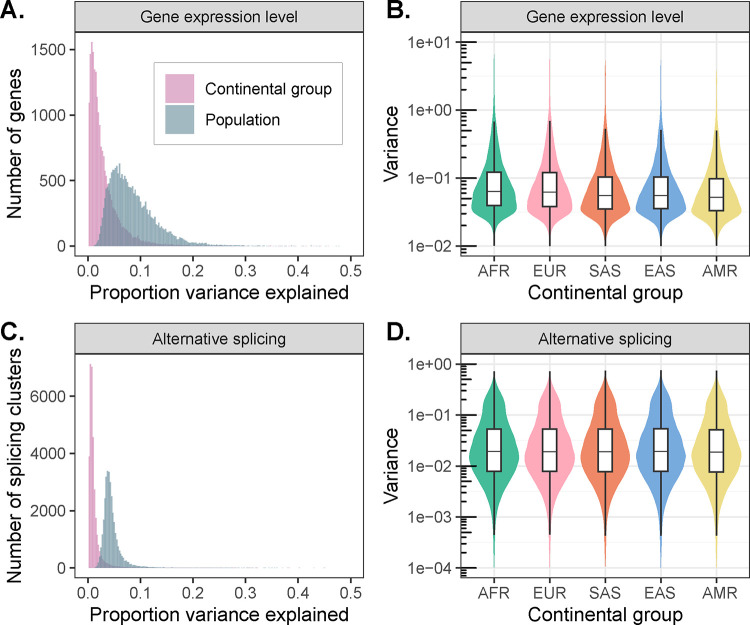
Figure 2. Patterns of transcriptomic diversity within and between populations.
(A) Per gene estimates of the proportion of variance in gene expression level that is partitioned between continental groups (pink) and populations (blue), as opposed to within continental groups or populations. (B) Variance in gene expression level per gene differs across continental groups, consistent with underlying differences in levels of genetic variation. (C) Per splicing cluster estimates of the proportion of variance in alternative splicing (intron excision ratios) that is partitioned between continental groups (pink) and populations (blue), as opposed to within continental groups or populations. (D) Variance in alternative splicing (intron excision ratios) per splicing cluster differs across continental groups, consistent with underlying differences in levels of genetic variation.

