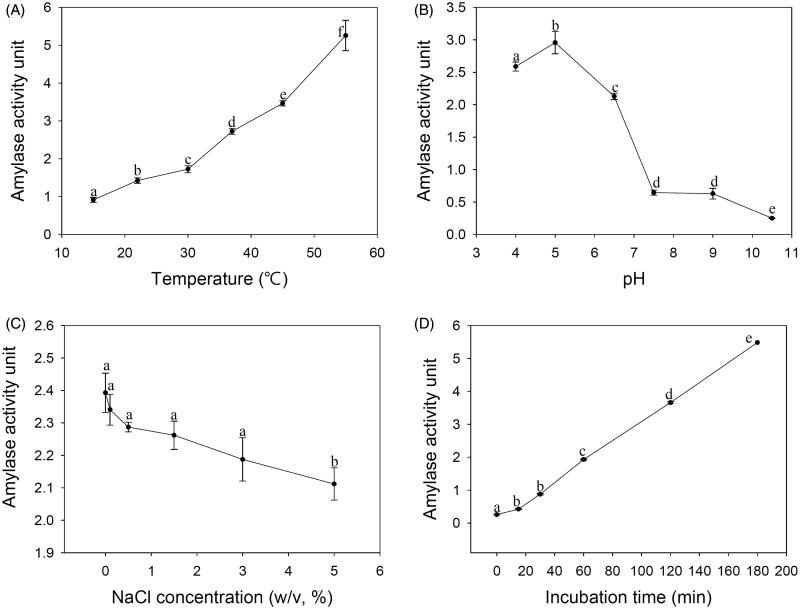
Figure 4.
Effects of temperature, pH, NaCl concentration, and incubation time on the amylolytic activity of PH-Gra1. A crude enzyme solution containing equal amounts of protein was incubated with 0.5% starch at the selected (A) temperature, (B) pH, (C) NaCl concentration, and (D) incubation time. Amylolytic activity was calculated from the mean and standard deviation of three biological replicates. Alphabetical letters on the graph indicate differences that are statistically significant (p < .05) by ANOVA analysis followed by Tuckey’s test.

