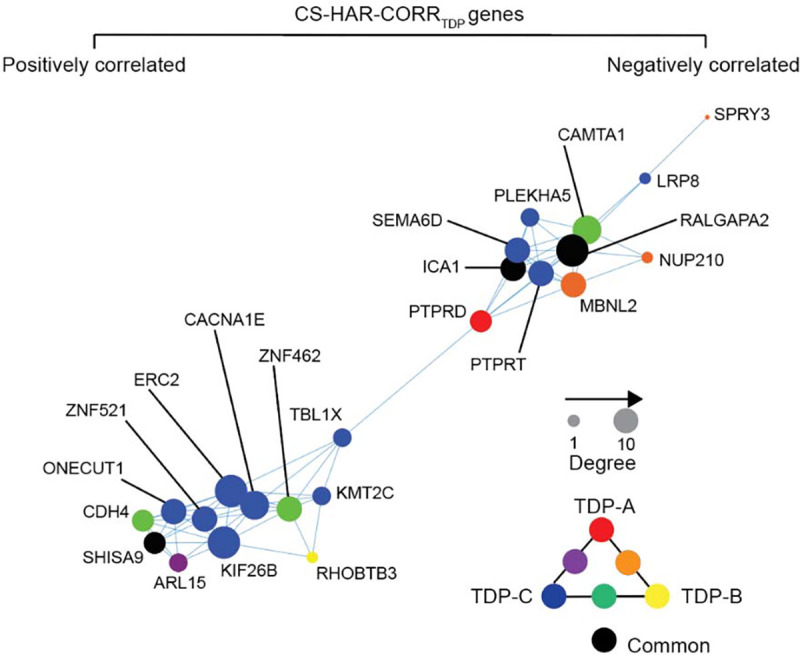
Figure 6. Co-expression network of CS-HAR genes associated with FTLD-TDP atrophy.

The regional expression covariance of CS-HAR genes associated with FTLD-TDP atrophy was used to generate a topographical network of gene expression. The size of each circle reflects the centrality of each gene in the network, while the color of the circles reflects which FTLD-TDP subtype whose atrophy pattern correlated with the gene’s expression pattern.
