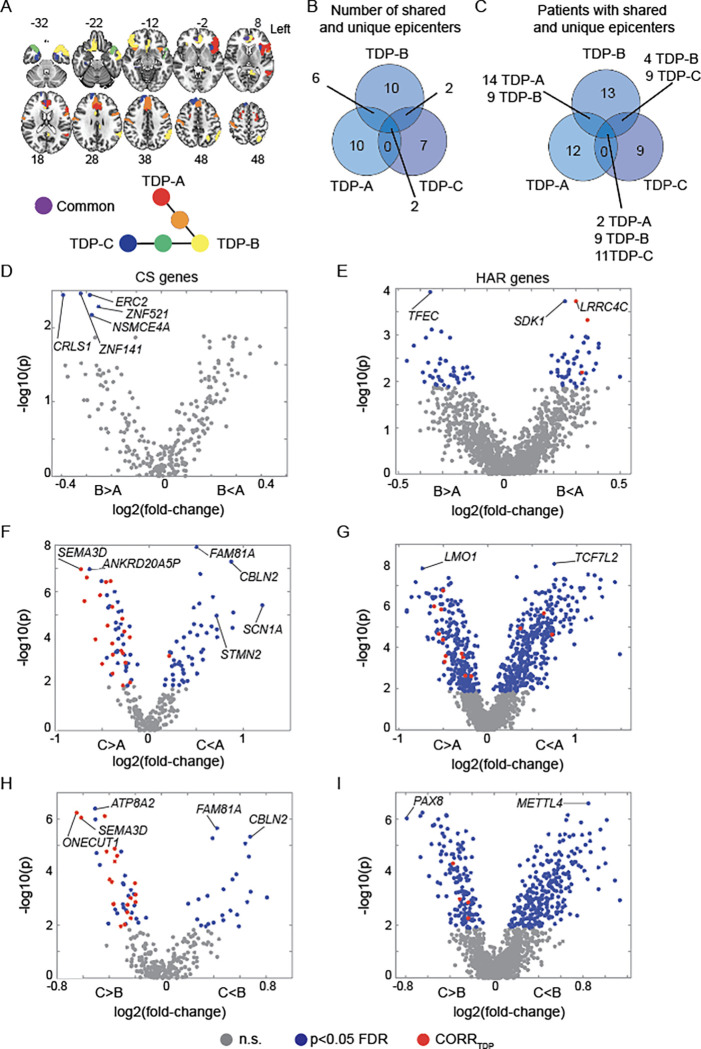
Figure 7. Normative expression of CS and HAR genes in FTLD-TDP disease epicenters.
(A) Neuroanatomical distribution of FTLD-TDP subtype unique and shared epicenters. (B) Number of epicenters unique or shared across FTLD-TDP subtypes. (C) Number of patients with FTLD-TDP having unique or shared epicenters. Epicenters’ normative expression of CS genes compared between (D) TDP-A and TDP-B, (E) TDP-A and TDP-C, and (F) TDP-B and TDP-C. Epicenters’ normative expression of HAR genes compared between (G) TDP-A and TDP-B, (H) TDP-A and TDP-C, (I) TDP-B and TDP-C. Grey circles depict genes with normative expression within epicenters that do not significantly (n.s.) differ across FTLD-TDP subtypes, blue circles depict genes with normative expression within epicenters that significantly differ (FDR adjusted p < 0.05) across FTLD-TDP subtypes, red circles depict genes with normative expression within epicenters that significantly differ (FDR adjusted p < 0.05) across FTLD-TDP subtypes and also positively correlate with atrophy in the FTLD-TDP subtype where they are more expressed.

