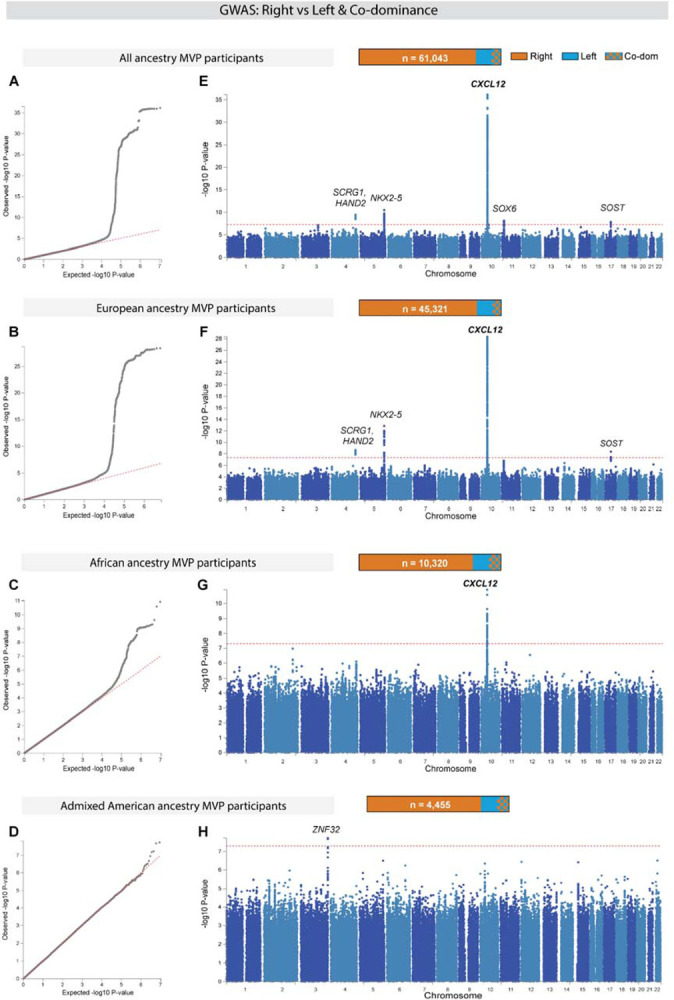
Figure 2. Genome-wide association study (GWAS) of right versus left/co-dominance in the Million Veteran Program (MVP).

GWAS was conducted in all participants independent of ancestry (All ancestry) as well as in each of the three largest genetically inferred ancestry subgroups: European, African, and Admixed American. (A-D) Quantile-quantile plots (Q-Q) show the observed versus expected P-values from association for all genetic variants. Red line indicates null hypothesis. (E-H) Manhattan plots for the corresponding Q-Q plots with P-values of genetic variants. Gene(s) mapped to regions reaching genome wide significance (GWS) are labeled. Red line indicates GWS threshold (P-value<5×10⁻⁸).
