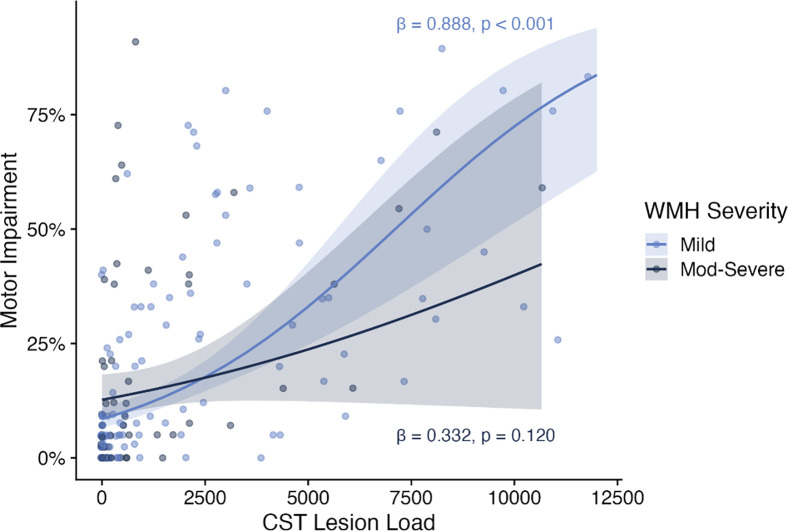
Figure 2:
Relationships between motor impairment and CST Lesion Load stratified by WMH severity
Motor impairment by CST Lesion Load, stratified by WMH severity (light blue = mild WMHs, dark blue = moderate-severe WMHs). Plots present beta regression line (solid), standard error (shaded), and parameter eatimates (text) for stratifeid models

